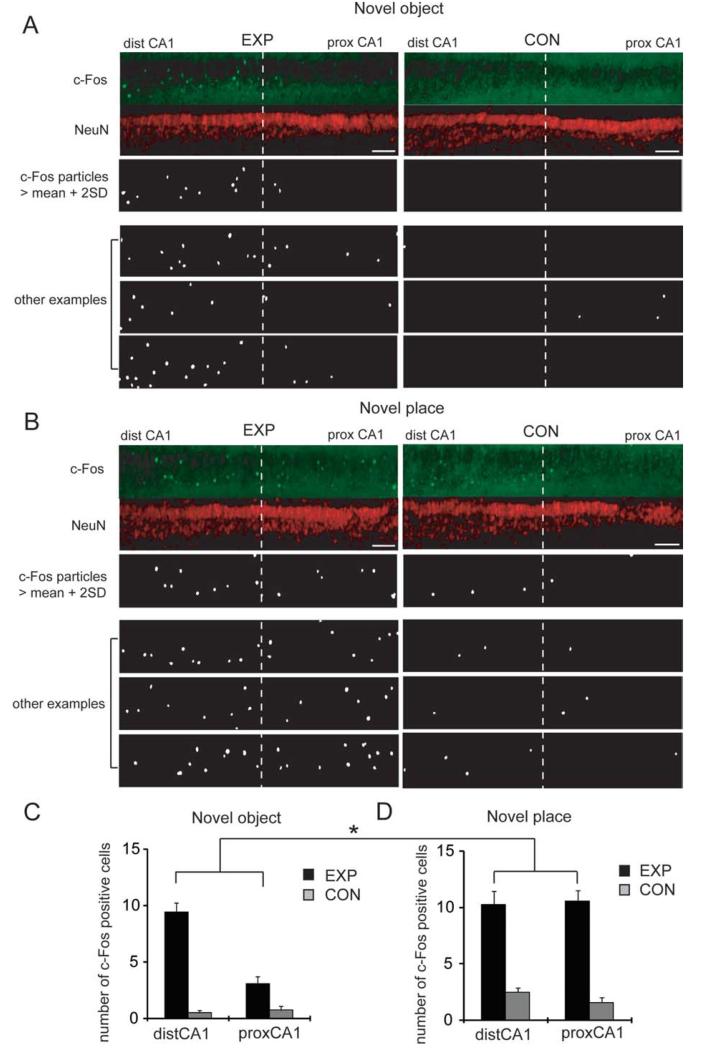
FIGURE 1.
Differential c-Fos expression between proximal and distal CA1 after exposure to a novel object or place. (A) Pairs of animals were individually housed in a home cage for at least 2 days. For the experimental animal, the cage was opened, and three toys were placed inside (“EXP”). For the control animal, the cage was opened, but no object was inserted (“CON”). After 2 h, hippocampal slices were prepared from both animals, fixed, and immunostained with c-Fos and NeuN antibodies. c-Fos particles were detected and analyzed (see Methods section). Representative images show the pyramidal layer of area CA1 of “EXP” and “CON” animals (straightened by ImageJ; scale bar = 100 μm). (B) A pair of animals was individually housed in a home cage for at least 2 days. For one of animals, the cage was opened, and the animal was carried up and placed in a different cage (“EXP”). For another animal, the cage was opened, and the animals were carried up but placed back in the original cage (“CON”). After 2 h, slices were prepared and immunstained as in (A). Images shown are from the pyramidal layer of area CA1 of “EXP” and “CON” animals (straightened by ImageJ; scale bar = 100 μm). (C) The number of c-Fos positive cells was analyzed in the pyramidal layer of area CA1 in each 50 μm slice. Area CA1 was equally divided into two parts, representing distal and proximal CA1. The number of c-Fos positive cells was significantly higher in distal CA1 following exposure to novel objects, when compared with proximal CA1 (P = 0.0001 in Wilcoxon rank sum test; n = 6 pairs of animals). The total integrated NeuN signal in same areas used for c-Fos expression analysis did not differ between groups (Supporting Information Fig. 1B). D: The number of c-Fos positive cells was analyzed in the pyramidal layer of area CA1 in each slice. The number of c-Fos positive cells was high in both distal and proximal CA1 following exposure to a novel place (n = 6 pairs of animals). The total integrated NeuN signals in same areas used for c-Fos expression analysis did not differ between groups (Supporting Information Fig. 1B). For the analysis of novelty-induced c-Fos expression, a two-way ANOVA was performed with two variables, novelty type (object vs. place) and CA1 subregion (distal vs. proximal), and revealed a significant interaction (P = 0.0008).

