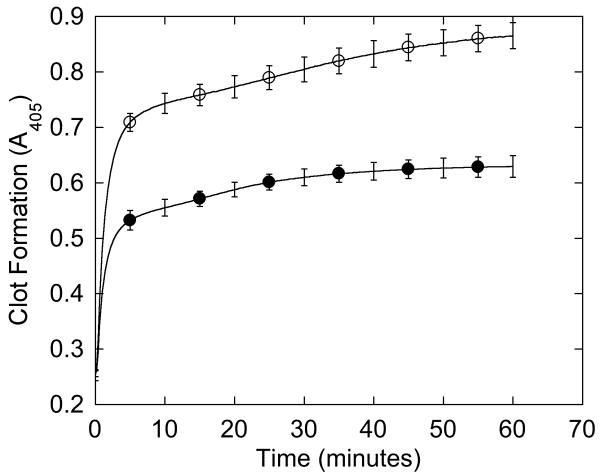
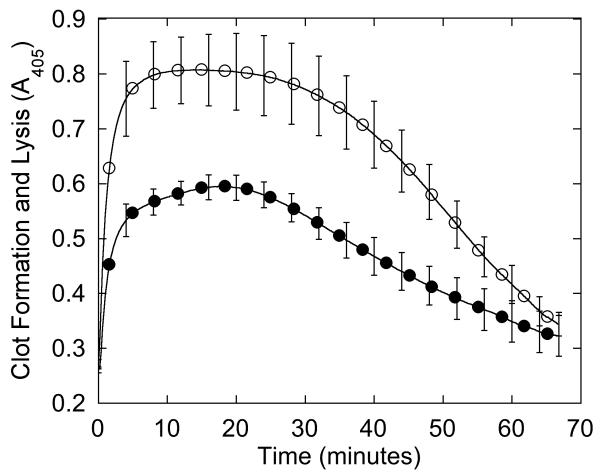
Figure 1. Plasma demonstrates impaired clot formation and fibrinolysis.
(A-B) Plasma was clotted with CaCl2 and thrombin (20 mM and 10 nM, final, respectively) in the absence (A) and presence (B) of 0.25 μg/mL tPA. Data shown are representative of three separate reactions performed in triplicate at room temperature and followed by turbidity at 405 nm. Symbols are: NPP (○) and patient plasma (●).


