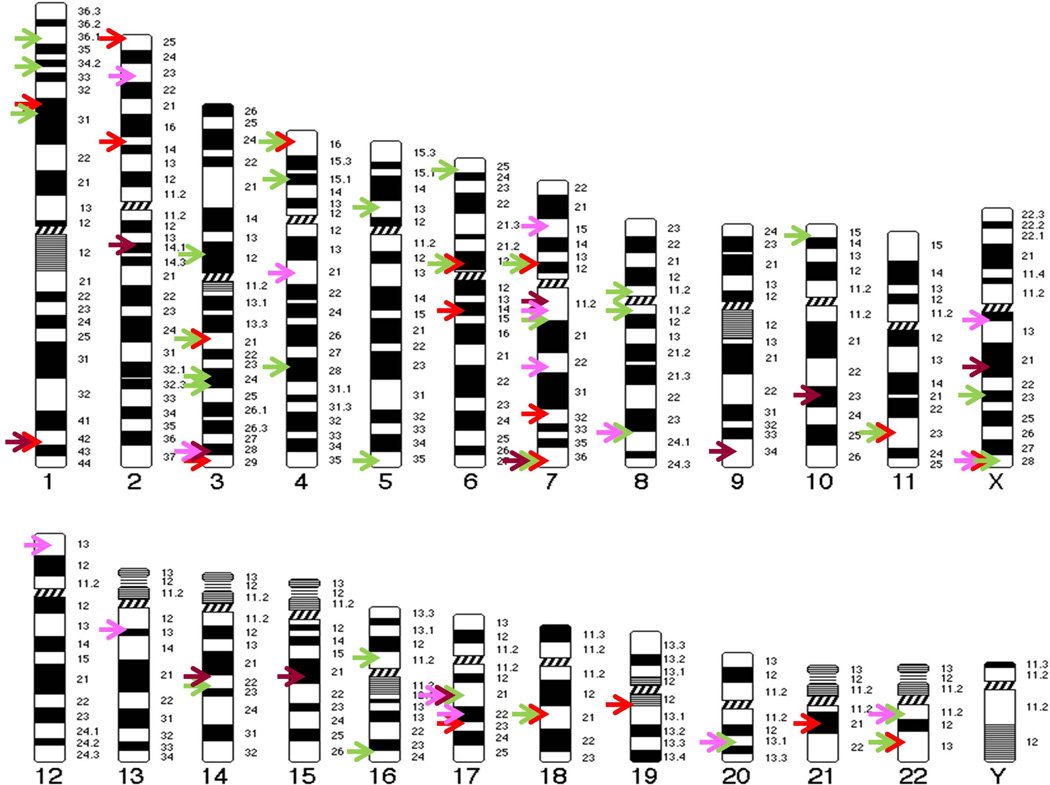
FIGURE 5.
Chromosome map of genomic loci associated with congenital anomalies of the lower urinary tract. Each arrow indicates the physical mapping position of a single locus. Different malformations are represented by different colors as following: hydronephrosis (Red), vesicoureteral reflux (Green), bladder anomalies (Brown), urethra anomalies (Purple). See Table 1–4 for details about gene names, chromosome locations, and associated phenotypes, etc.

