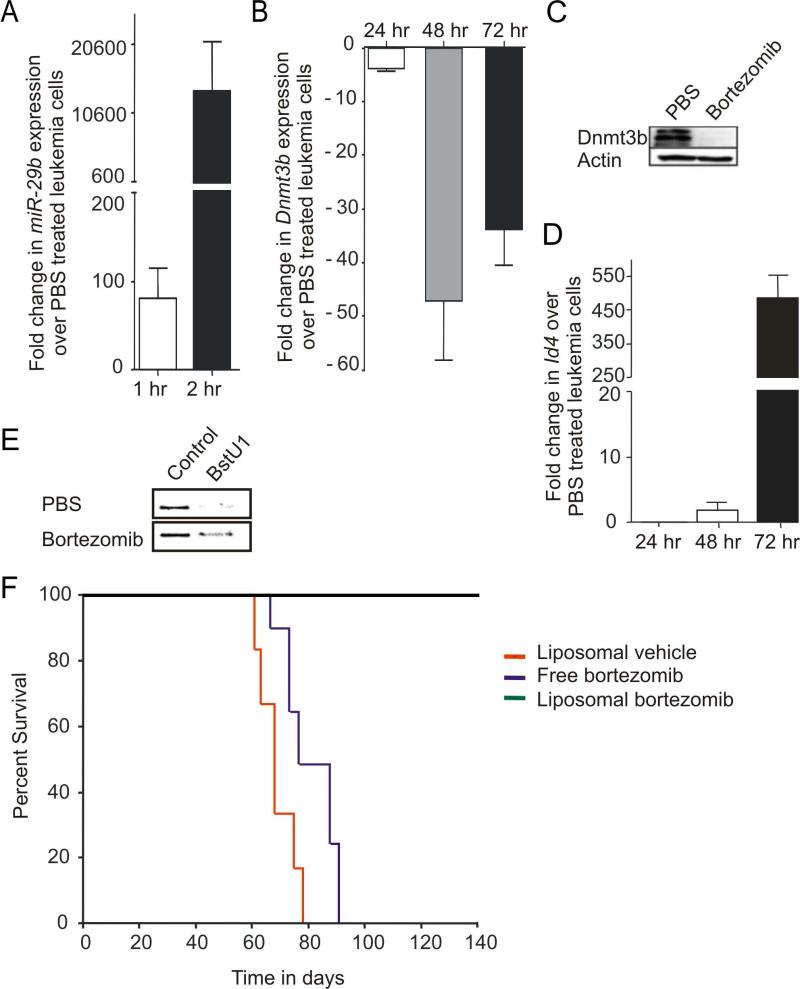
Figure 6. In vitro and in vivo targeting of miR-29b transcriptional repression.
(A) Fold increase in miR-29b transcript at 1 (white) and 2 (black) hours post in vitro bortezomib treatment (20μM). Both measurements normalized to U6 and then set relative to values of miR-29b measured in PBS treated LGL leukemia cells, which are arbitrarily set at 1. (B) Relative fold changes in mRNA expression of Dnmt3b in bortezomib (20nM) treated LGL leukemia samples at 24, 48 and 72 hour, normalized to 18S mRNA and then quantified relative to values of Dnmt3b in PBS treated LGL leukemia samples that are arbitrarily set at 1. Data for (A) and (B) are mean ± SEM (n=3). (C) Splenocytes from LGL leukemic mice were treated in vitro with either control (PBS) or bortezomib (20nM) for 24 hours and then immunoblotted for Dnmt3b and actin that was used as an internal control. (D) Relative fold changes (mean ± SEM) in mRNA expression of Idb4 in mouse LGL leukemia cells treated in vitro with bortezomib (20μM) at 24, 48 and 72 hour, normalized to 18S mRNA and then quantified relative to values of Idb4 in PBS treated LGL leukemia samples that are arbitrarily set at 1. (E) COBRA analysis for Idb4 promoter methylation in splenocytes from LGL leukemic mice that were treated in vitro for 72 hours with either control (PBS) or bortezomib (20nM). Amplification of the Idb4 promoter region and sequential COBRA analysis with a methylation sensitive restriction enzyme (BstU1) reveals only a partial loss of methylation at the Idb4 promoter in LGL leukemia cells treated with bortezomib (20μM), but not PBS. (F) Kaplan–Meier survival plot for ICR-SCID mice (n = 6–8/group) after intravenous injection of splenocytes from LGL leukemia mice. Disease-free survival in mice treated with empty liposomes, free-bortezomib and liposomal-bortezomib.
See also Figure S4.

