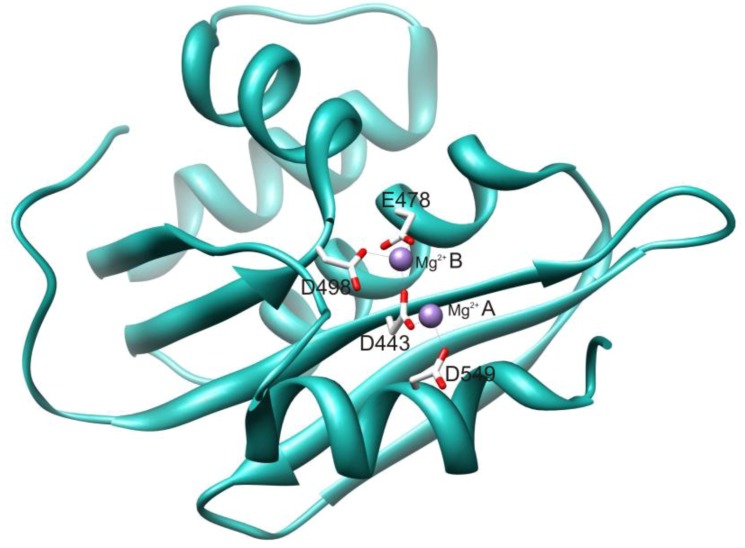
Figure 2.
Structure of the RNase H domain of HIV-1 RT. Active site catalytic residues are depicted in stick form and the active site Mg2+cations are shown as spheres. The figure is derived from PDB file 3K2P and was drawn using UCSF Chimera software [6].

