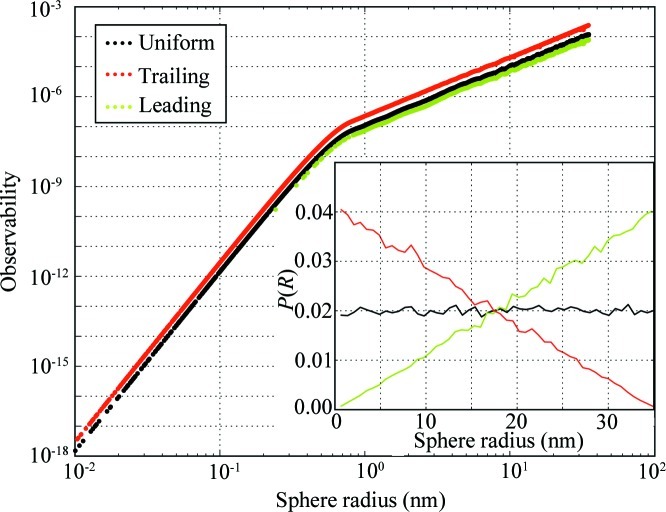
Figure 2.
Observability for three unimodal number-weighted size distributions sampled using 50 000 spheres within  . The number frequency plot of the size distributions is shown in the inset, with the distributions divided over 50 radius bins and normalized to
  . A change in slope between
  and
and  is observed for all three distributions at
  .
.

