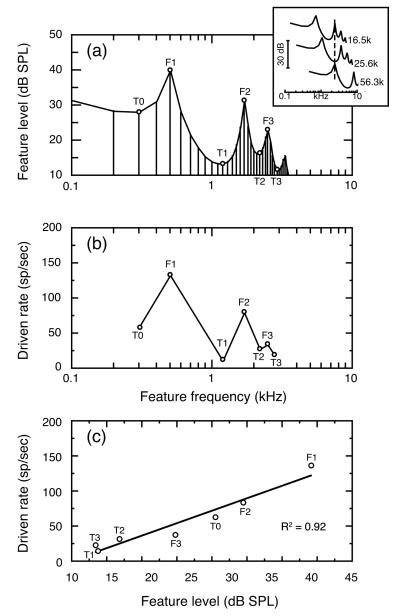
FIGURE 1. Spectral manipulation procedure (SMP) for sampling auditory-nerve fiber responses to vowel-like stimuli.
(a) Amplitude spectrum of the prototypic /ε/ at a vowel level of 43 dB. Formant frequencies were placed at 500, 1700, and 2500 Hz. Individual fibers were tested with spectral features that represented three formants (F1 – F3) and four troughs (TO – T3) in the vowel’s amplitude spectrum (open symbols). These features were shifted to the unit’s BF by changing playback sampling rates (inset), (b) Rate responses obtained from a high SR auditory-nerve fiber during SMP testing with the 43 dB vowel. This analog of a population study rate-place profile was created by plotting driven rates for each test feature at the frequency location of that feature in the prototypic vowel, (c) Rate-level function produced by plotting the same rate responses according to the SPL of test features. The unit’s driven rates to different spectral features were highly correlated with feature level (R2=0.92).

