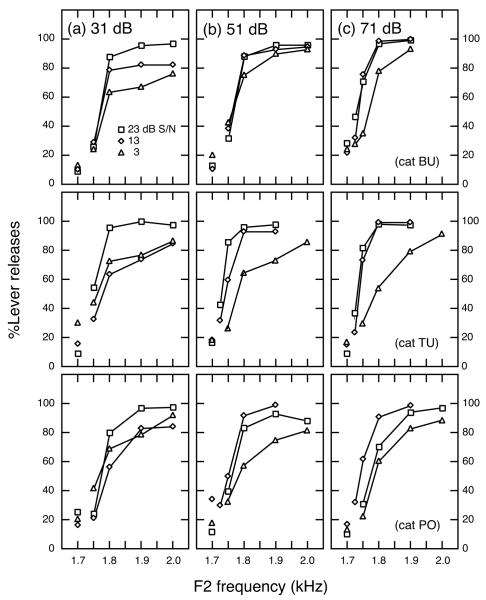
FIGURE 11. Psychometric functions for three different S/Ns, at three vowel levels.
The percentage of correct lever releases to comparison vowels (hits) are plotted as a function of the change in F2 between standard and comparison vowels. The percentage of incorrect lever releases to catch trials (false alarms) are indicated by unconnected symbols at 1.7 kHz. (a–c) Vowel levels are 31, 51, and 71 dB. Data for cats BU, TU, and PO are shown in upper, middle, and lower rows, respectively.

