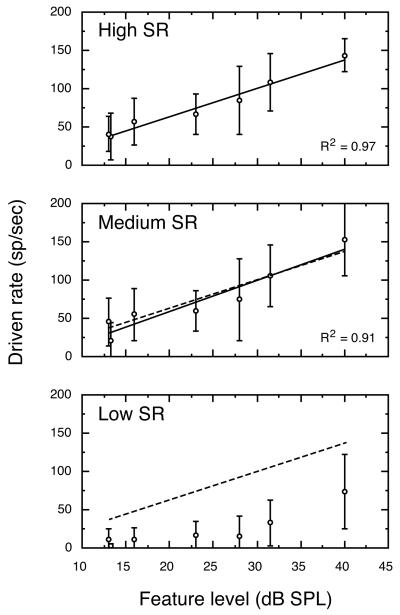
FIGURE 3. Average rate-level functions for all high, medium and low SR fibers that were SMP tested at a 43 dB vowel level.
Correlation coefficients refer to the linear regression for each SR class (solid lines). For comparison, the regression for high SR fibers is plotted in all panels (dashed lines). No regression line is shown for low SR fibers because most units in this SR class failed to respond to the formant structure of a 43 dB vowel. Error bars indicate ±1 SD.

