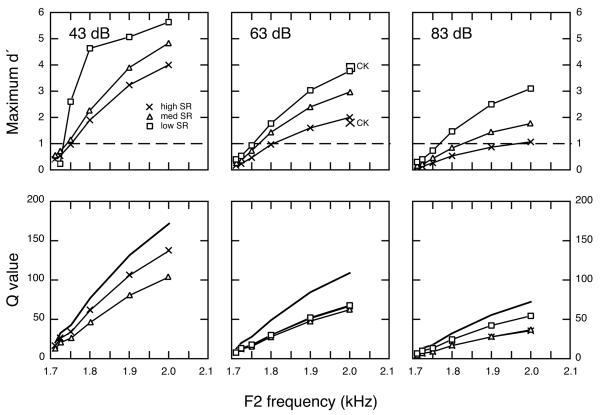
FIGURE 9. Signal detection analysis of the rate representation of F2 frequency changes in quiet.
(upper panels) Maximum d’ values as a function of the F2 frequency of comparison vowels. Symbols with CK notation show maximum d’ values that were interpolated from results of Conley and Keilson (1995). Dashed lines indicate d’ of 1. (lower panels) Q statistics for the same F2 frequency changes. Qtotal values (bold lines) dropped sharply with increases in vowel level.

