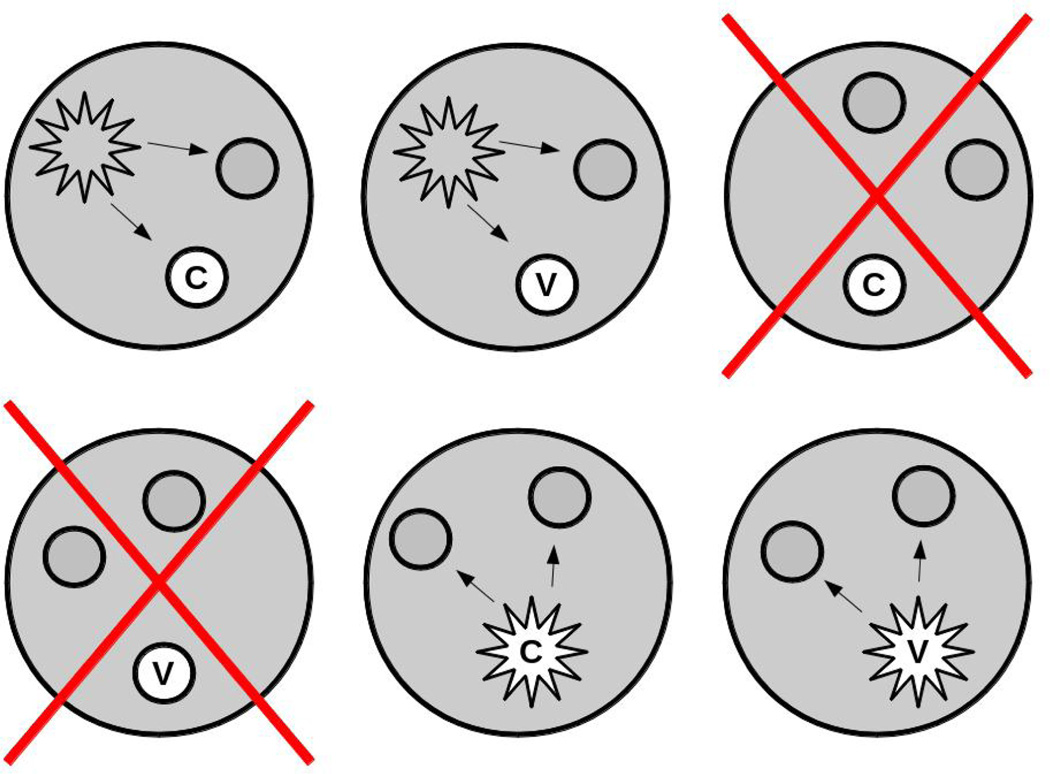
Figure 2.
Sample of households used to estimate vaccine efficacy for infectiousness. As in Figure 1, the larger shaded circles represent households. Each household has three individuals in it, one of whom, indicated in white, is in an individually randomized, controlled trial of a vaccine (v) versus control (c). The smaller circles represent uninfected people, the stars represent infected people. The large Xs indicate that a household is not included in the analysis. One could include only households in which the first case in the household was in the randomized trial.

