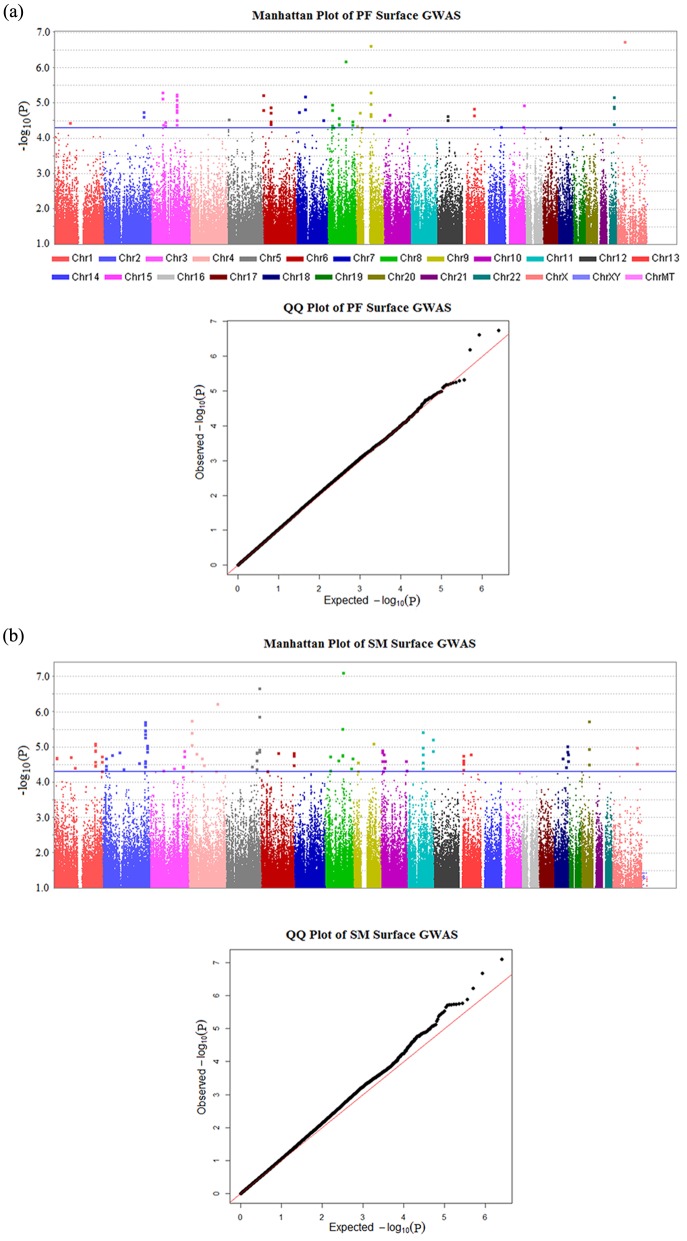
Figure 1.
Manhattan plots (upper panel) and quantile-quantile plots (lower panel) for GWAS of PF- and SM-surface caries. (a) PF-surface scan; (b) SM-surface scan. Manhattan plots show negative log10-transformed p values (y-axis) across the whole genome (x-axis). The genomic inflation factors (λ) are 1.02 for PF-surface scans and 1.04 for SM-surface scans. Percentage of p values used to calculate λ was set at .95. Blue horizontal lines represent the suggestive significance threshold (p value < 5E-5). Red diagonal lines represent the expected distribution of p values under the null hypothesis of no association. Genotyped and imputed SNPs are plotted together.

