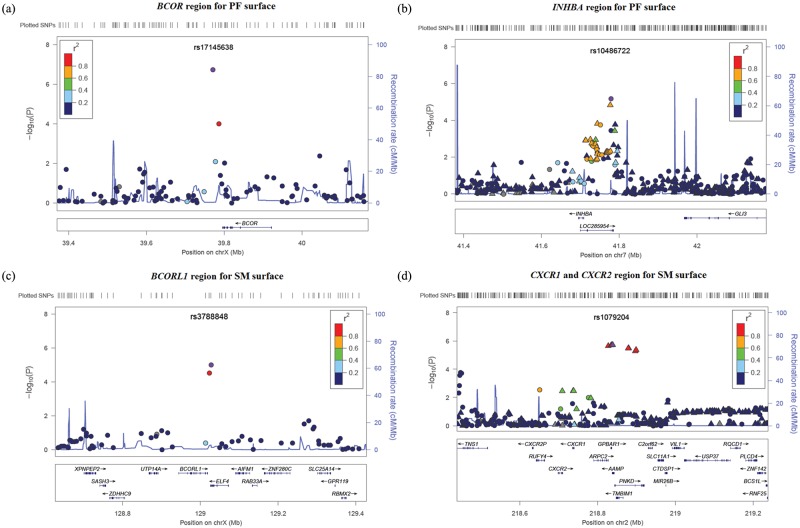
Figure 2.
LocusZoom plots for regions of interest. (a) Suggestive locus near BCOR for PF-surface GWAS; (b) suggestive locus near INHBA for PF-surface GWAS; (c) suggestive locus near BCORL1 for SM-surface GWAS; and (d) suggestive locus near CXCR1 and CXCR2 for SM-surface GWAS. Negative log10-transformed p values and physical positions for SNPs in the regions are shown. The recombination rate overlay as well as colors indicating linkage disequilibrium between the top SNP (purple) and other SNPs are based on HapMap Phase II CEU data (hg18) for chromosome X, or 1000 Genomes CEU data (hg18) for other chromosomes. The rug plot indicates regional SNP density. Gene positions and directions of transcription are annotated. Circles represent genotyped SNPs, and triangles represent imputed SNPs.

