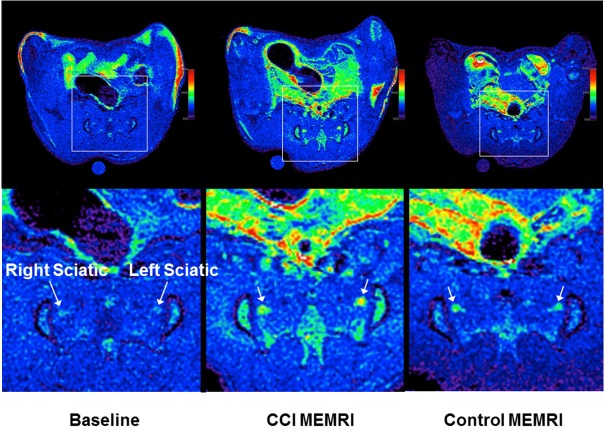
Figure 4.
Transaxial images of a representative baseline scan, and representative MEMRI scans from each group showing the sciatic nerves in the pelvis anterior to the sacrum. The top row shows the entire slice while the bottom row zooms into the relevant part as marked by boxes in the top row. All images are similarly windowed. MEMRI improves the signal in both groups over baseline. In MEMRI, the CCI animal shows higher signal intensity in the sciatic nerve than the control animal. The higher signal relative to the surrounding muscle makes the nerves more visible in the CCI MEMRI.

