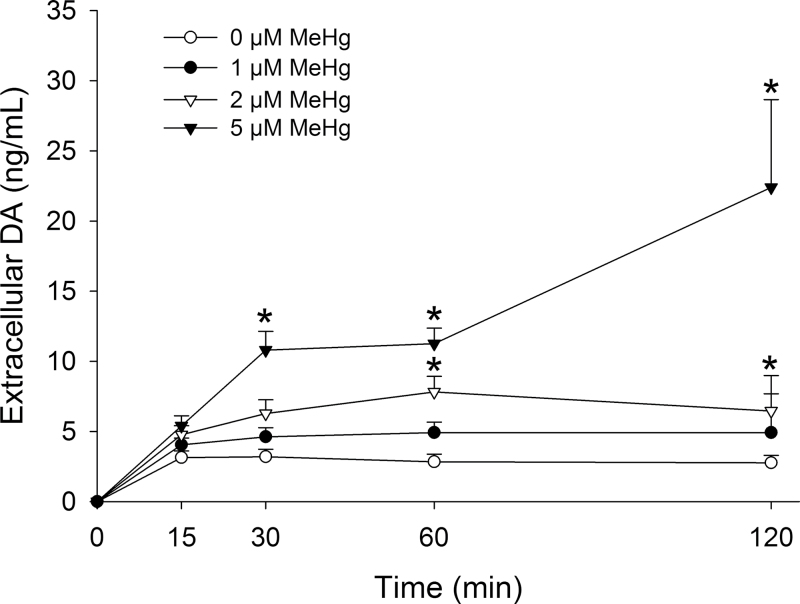
Fig. 1.
Concentration-response and time-course effects of MeHg on extracellular DA concentration. PC12 cells were treated with 0µM (white circles), 1µM (black circles), 2µM (white triangles), or 5µM (black triangles) MeHg in HBS for 15, 30, 60, or 120min. * indicates a significant difference compared with 0µM MeHg for a given time point (p ≤ 0.05). Values are means ± SEM (n = 3–4, three replicates per n).

