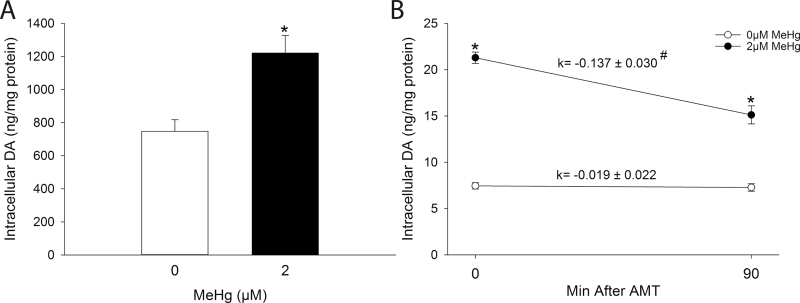
Fig. 4.
(A) Effect of MeHg on intracellular DA concentration. PC12 cells were treated with either 0µM (white bars) or 2µM (black bars) MeHg in HBS for 60min. * indicates a significant difference from 0µM MeHg (p ≤ 0.05). (B) Effect of MeHg on DA storage utilization. PC12 cells were preincubated with 300µM AMT or vehicle in culture medium for 30min prior to treatment with either 0µM (white bars) or 2µM (black bars) MeHg in HBS in the presence or absence of 300µM AMT for 60min. The rate constant (k) was calculated as the slope of the line between 0 and 90min after AMT. * indicates a significant difference from 0µM MeHg within time point (p ≤ 0.05). # indicates a significant difference between rate constants (p ≤ 0.05). Values are means ± SEM (n = 3, three replicates per n).

