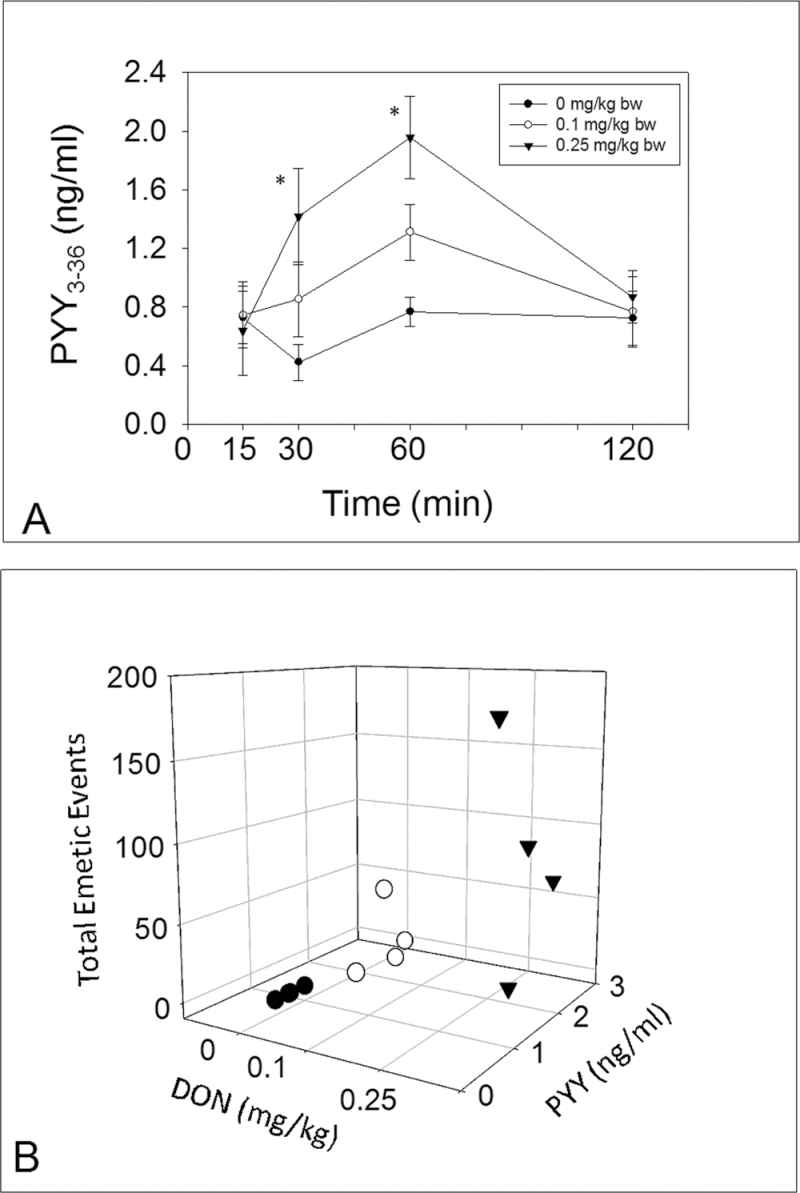
Fig. 2.
Emesis induction corresponds to elevation in plasma PYY3–36. (A) Kinetics of DON-induced plasma PYY3–36 concentration. Data are the mean ± SEM (n = 4 per group). A two-way ANOVA using Bonferroni t-test was used to assess significant differences in kinetics of PYY3–36 concentration in plasma. Asterisk indicates statistically significant differences in PYY3–36 concentration compared with the control at p < 0.05. (B) Relationship between total emetic events and PYY3–36 levels at 60min in DON-treated mink. Cumulative emetic events significantly correlated with PYY3–36 (Spearman rank-order correlation coefficient = 0.651, p < 0.05).

