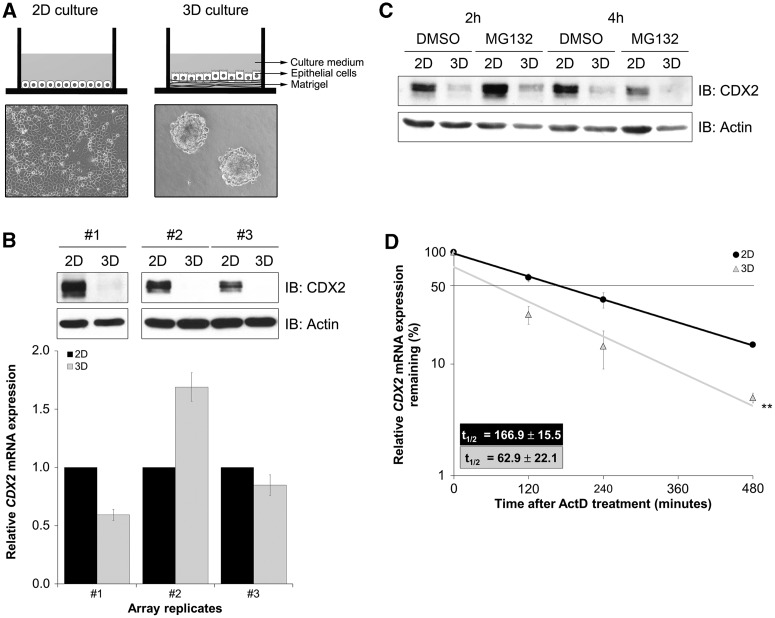
Figure 1.
Establishment of AGS 3D cultures and characterization of CDX2 expression. (A) Schematic representation of the culture systems and cellular morphology at culture day 4 in bright field microscopy (original magnification, ×100). (B) Western blot and qPCR of CDX2 expression in 2D and 3D after 2 weeks culture. Cardinal numbers represent biological replicates. Values for CDX2 mRNA expression in 2D culture were referred to as 1. (C) Western blot of CDX2 protein expression on treatment with MG132. (D) qPCR of CDX2 mRNA expression on treatment with actinomycin D. Expression levels in the absence of treatment were set at 100%. Depicted half lives were calculated using exponential regression (**P = 0.003).

