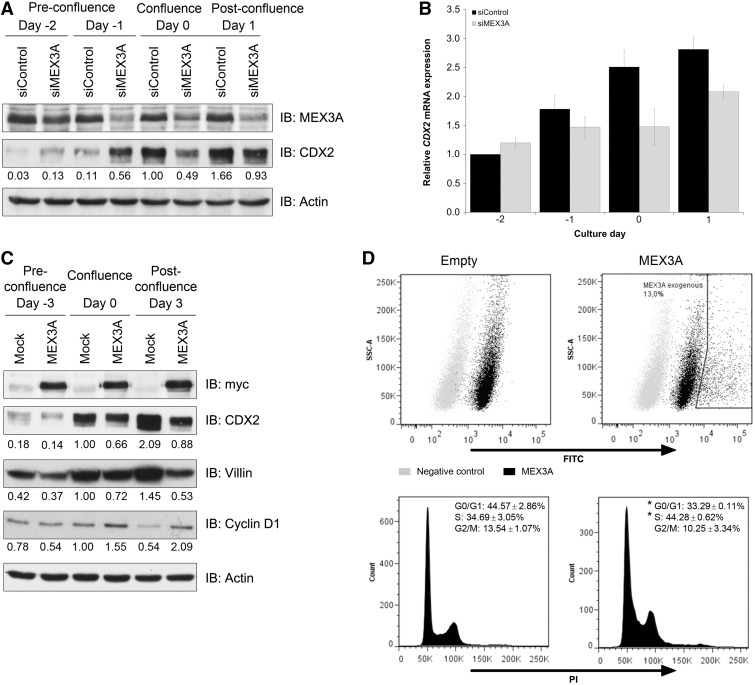
Figure 5.
MEX3A modulation of intestinal phenotype in Caco-2 cells. (A) Western blot of MEX3A inhibition with transfection of siRNAs performed at day −3 and day −1. (B) qPCR of CDX2 mRNA expression in the same samples. The value for CDX2 at day −2 for the siControl sample was referred to as 1. (C) Western blot of MEX3A stably transfected cells at different confluences for differentiation and proliferation markers. (D) Flow cytometry analysis of MEX3A transiently transfected cells. Dot plots depicting negative control (secondary antibody only) and FITC-conjugated MEX3A expression levels are shown on top. DNA content histograms showing population percentages for the different cell cycle phases of the empty vector transfected cells and MEX3A-transfected cells (gate MEX3A exogenous) are shown below (*P = 0.03 for G0/G1 phase and *P = 0.05 for S phase).

