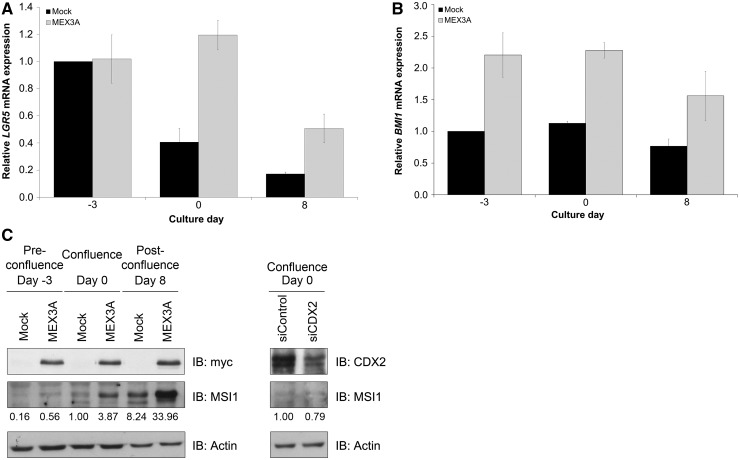
Figure 6.
Expression profiles of intestinal stem cell markers in Caco-2 cells. (A) qPCR of LGR5 mRNA expression in mock and MEX3A overexpressing cells. The value for LGR5 at day −3 for the mock sample was referred to as 1. (B) qPCR of BMI1 mRNA expression in the same samples. The value for BMI1 at day −3 for the mock sample was referred to as 1. (C) Western blot analysis of MSI1 expression in the same samples and in Caco-2 parental cell line with CDX2 inhibition by siRNAs at the confluence time point.

