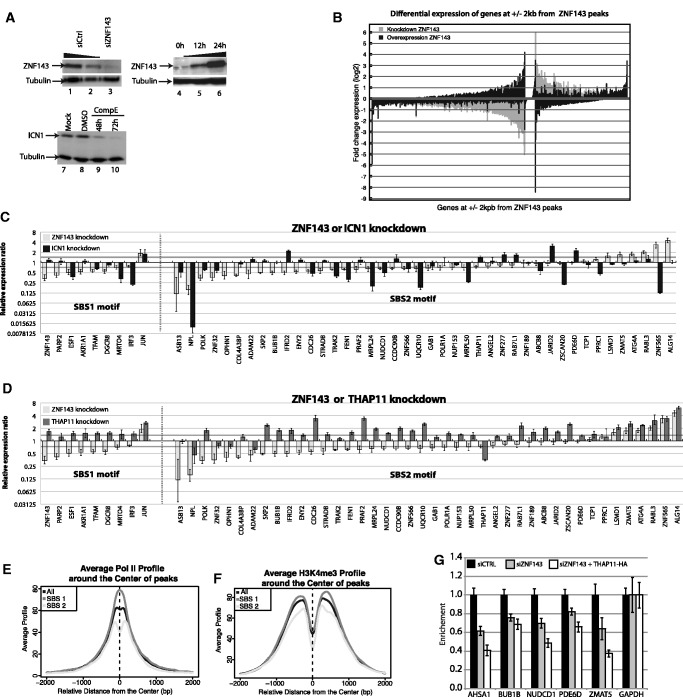
Figure 6.
ZNF143, THAP11 and ICN1 co-regulate the expression of target genes. (A) Western blots showing (i) knockdown of ZNF143 at 72 h post-transfection of HeLa cells with specific siRNA (lane 3) and siRNA control (lanes 1 and 2); (ii) over-expression of ZNF143 in FLP143 cells at 12 h (lane 5), 24 h (lane 6) post-induction, uninduced cells (lane 4); (iii) knockdown of ICN1 at 48 h and 72 h post- treatment of HPB-ALL cells with 500 nM of GSI (compound E) (lanes 9 and 10), DMSO treated (lane 8) and non-treated cells (lane 7). Tubulin was used as a loading control. (B) Bar chart depicting the RNA-Seq expression profiling of all genes located at +/−2 kb of a ZNF143 peak summit, after knockdown or over-expression of ZNF143. In grey and black are represented the fold change of expression 48 h after siRNA-mediated knockdown and 24 h after induced over-expression of ZNF143 compared with control, respectively. The genes are ordered decreasingly according their positive or negative fold change expression after ZNF143 knockdown. (C) Bar chart depicting the relative gene expression ratio determined by RT-qPCR for genes containing SBS1 or SBS2 sites, after ICN1 and ZNF143 knockdown compared with control. RNA was extracted 72 h post-transfection of HeLa-S3 cells with specific siRNAs targeting ZNF143 and from HPB-ALL cells 72 h post-treatment with 500 nM of GSI (compound E). Values represent the mean +/− SD of two or three independent experiments normalized to the GAPDH level. The dark grey line corresponds to a 0.5-fold expression ratio (D) Bar chart depicting the relative gene expression ratio determined by RT-qPCR for genes containing SBS1 or SBS2 sites, after THAP11 and ZNF143 knockdown compared with control. RNA was extracted 72 h post-transfection of HeLa-S3 cells with specific siRNAs targeting ZNF143 or THAP11. Values represent the mean +/− SD of two or three independent experiments normalized to the GAPDH level. The dark grey line corresponds to a 0.5-fold expression ratio (E) Average ChIP-Seq profile of Pol II and (F) Average profile of H3K4me3 around the centre of ZNF143-binding events identified in HeLa cells at +/−2 kb from a TSS (Supplementary Table S4). All ZNF143-binding events, binding events containing only SBS1 or only SBS2, are indicated in black, dark grey and light grey, respectively. (G) RNA Pol II-ChIP-qPCR enrichment analysis on promoters bound by THAP11 and containing SBS2 sites. Pol II-ChIP was performed on cells treated with control siRNA (siCTRL), knockdown for ZNF143 (siZNF143) or knockdown for ZNF143 and over-expressing THAP11 (siZNF143 + THAP11-HA). ChIP enrichment was measured by qPCR using specific primers on promoter compared with negative regions located at 2 kb. Values represent the mean +/− SD of two or three independent experiments normalized to the GAPDH promoter levels. Primers are available on request. The gene symbols listed are those of the genes closest to the tested genomic region.

