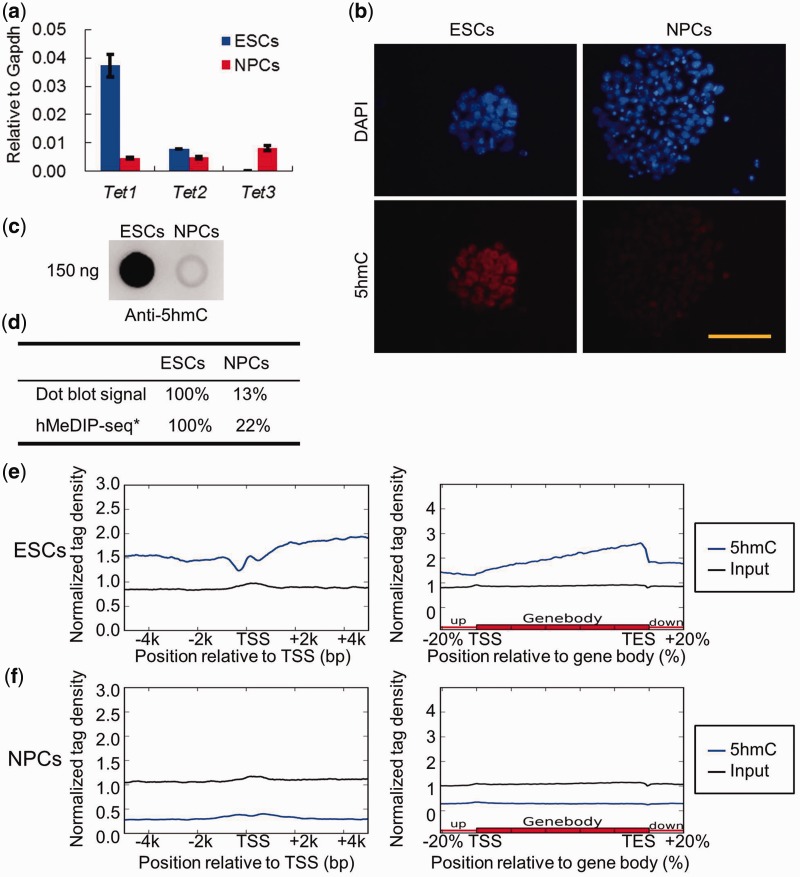
Figure 2.
Differential Tet1/2/3 gene expression and global 5hmC levels in ESCs and NPCs. (a) RT-qPCR analysis of Tet1, Tet2 and Tet3 mRNA levels in ESCs and NPCs (mean values ± SD, n = 3). (b) Immunofluorescence analysis of 5hmC levels in ESCs and NPCs. Bar: 50 μm. (c) Dot blot analysis of the global 5hmC levels in the gDNA of ESCs and ESC-derived NPCs. One hundred fifty nanogram gDNA for each dot. (d) The relative 5hmC signal of dot blot and comparative hMeDIP-seq in ESCs and NPCs. *The ratio of hMeDIP/Input reads numbers in ESCs was set as 100%. (e) Distribution of 5hmC in TSS ± 5 kb and gene body regions in ESCs. (f) Distribution of 5hmC in TSS ± 5 kb and gene body regions in NPCs.

