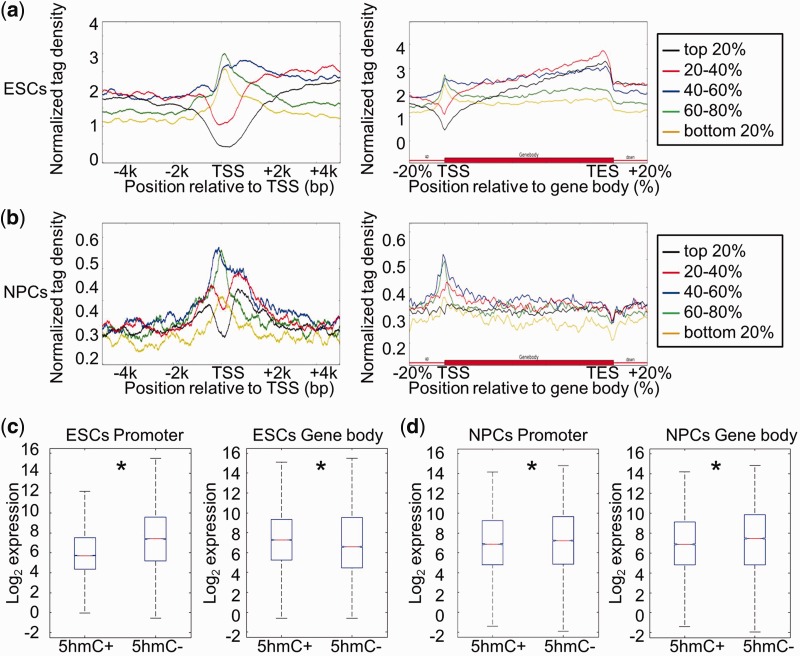
Figure 3.
Correlation between DNA hydroxymethylation and gene expression in ESCs and NPCs. (a) Genes were separated into five groups (from high to low) according to their expression levels in ESCs: top 20%; 20–40%; 40–60%; 60–80%; bottom 20%. The average 5hmC densities of the five groups of genes were plotted across the promoter or gene body regions. Left: TSS ± 5 kb regions. Right: gene body regions. (b) Genes were also separated into five groups according to their expression levels in NPCs. The average 5hmC densities of the five groups of genes were plotted across the promoter or gene body regions. Left: TSS ± 5 kb regions. Right: gene body regions. (c) Genes were classified into two groups with respect to the presence (5hmC+) or absence (5hmC−) of 5hmC peak(s) at their promoters (TSS ± 1 kb) or in gene body regions (from TSS + 1 kb to TES) in ESCs. Gene expression levels were compared between ‘5hmC+’ and ‘5hmC−’ groups. Left: promoter, P = 0; Right: gene body region, P = 1.08358e-13. *P < 0.01. (d) Genes were classified into two groups with respect to the presence (5hmC+) or absence (5hmC−) of 5hmC peak(s) at their promoters (TSS ± 1 kb) or in gene body regions (from TSS + 1 kb to TES) in NPCs. Gene expression levels were compared between ‘5hmC+’ and ‘5hmC−’ groups. Left: promoter, P = 0.0001; Right: gene body region, P = 0. *P < 0.01.

