Figure 5.
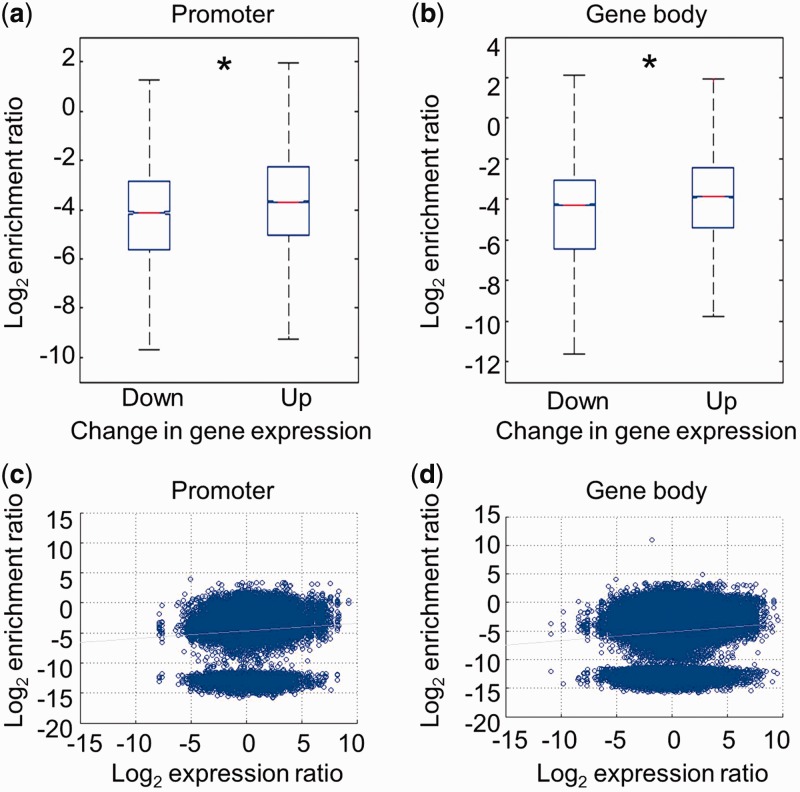
Relationship between the changes in DNA hydroxymethylation and gene expression during neural differentiation. (a) Down- and up-regulated genes during neural differentiation were sorted (NPC versus ESC, log2 mRNA expression ratio ≤ −1 or ≥1). The changes in 5hmC peak density at promoters (TSS ± 1 kb) in down- and up-regulated genes were compared during neural differentiation (P = 0). *P < 0.01. (b) The changes in 5hmC peak density at gene body regions (from TSS + 1 kb to TES) in down- and up-regulated genes were compared during neural differentiation (P = 0). *P < 0.01. (c) Dot plotting of the alteration in 5hmC peak density at promoters and the gene expression change during neural differentiation. The changes in 5hmC peak density at promoters (TSS ± 1 kb) were plotted on the y-axis and the corresponding gene expression changes were plotted on the x-axis. R2 = 0.0048. (d) Dot plotting of the alteration in 5hmC peak density in gene body regions and the gene expression change during neural differentiation. The changes in 5hmC peak density in gene body regions (from TSS + 1 kb to TES) were plotted on the y-axis and the corresponding gene expression changes were plotted on the x-axis. R2 = 0.0059.

