Figure 1.
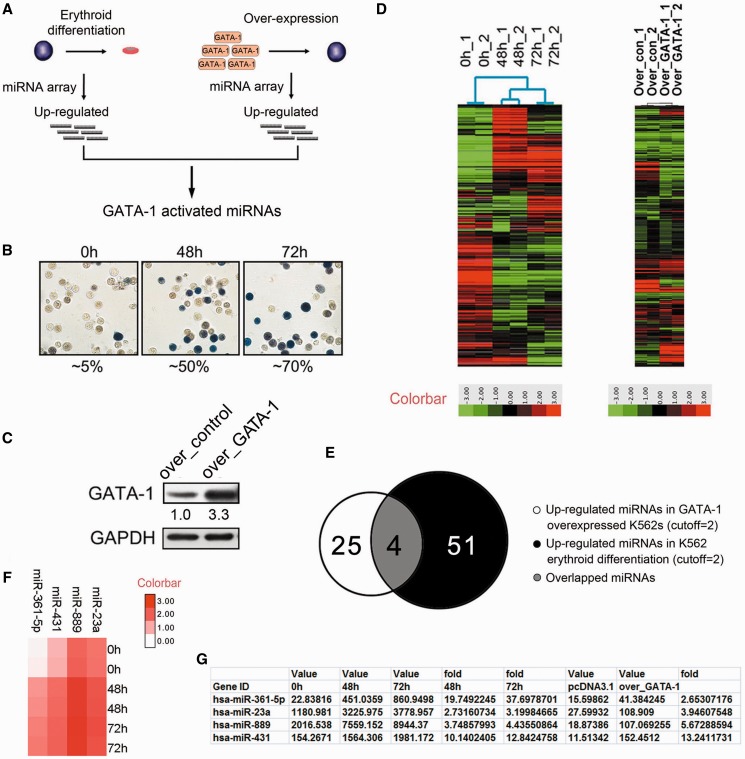
Identification of GATA-1-activated miRNAs in K562 cells. (A) The strategy to screen for GATA-1-activated miRNA genes in erythroid cells. (B) Benzidine staining of K562 cells after hemin treatment for 0, 48 or 72 h. Hemoglobinized cells were stained dark blue/brown. The percentage of benzidine-positive cells was indicated below the panel. (C) Western blot analysis of K562 cells transfected with a pcDNA construct overexpressing GATA-1 (over_GATA-1) for 48 h. Signals are normalized to GAPDH, and the values, expressed as fractions with respect to the empty vector (over_control), are indicated below. (D) miRNA microarray of hemin-treated and GATA-1 overexpressing K562 cells at 0, 48 and 72 h. Each sample is biologically duplicated. (E) Venn diagram showing the number of upregulated miRNA genes after hemin treatment (black), the number of upregulated miRNA genes after GATA-1 overexpression (white) and the overlap (gray) between the two. (F) Heatmap showing the expression profiles of miRNA genes that are potentially activated by GATA-1 during K562 erythroid differentiation. (G) Detailed array information of potential GATA-1-activated miRNA genes.

