Figure 4.
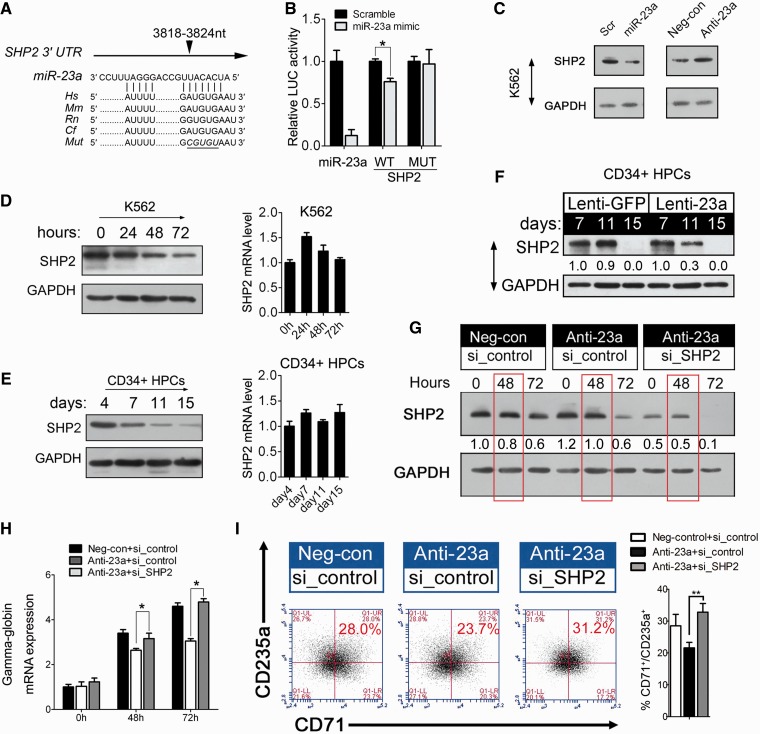
miR-23a directly targets SHP2 to promote erythroid differentiation. (A) Computer prediction of miRNA-binding site in the 3′ UTR of SHP2. (B) Relative luciferase activity of the indicated reporter constructs. Firefly luciferase activity was normalized to the activity of coexpressed Renilla luciferase. Results represent three independent experiments. Mean ± SD were obtained from three independent experiments. (*) Luciferase activity was significantly reduced in miR-23a mimic-transfected 293T cells compared with the scrambled control (*P < 0.05). miR-23a represents a positive construct containing the perfect complementary sequence to mature miR-23a. (C) Western blot analysis of SHP2 expression in K562 cells transfected with scrambled oligonucleotide or miRNA mimic/miRNA inhibitor. (D) Western blot analysis of SHP2 in K562 cells undergoing erythroid differentiation (left). qPCR analysis of SHP2 in K562 cells undergoing erythroid differentiation (right). (E) Western blot analysis of SHP2 in CD34+ HPCs during erythroid induction (left). qPCR analysis of SHP2 in CD34+ HPCs in erythroid induction culture (Right). (F) Western blot analysis of SHP2 in the CD34+ HPCs that were infected with Lenti-23a or Lenti-GFP and cultured in erythroid induction medium for the indicated times. (G) Western blot analysis of SHP2 in K562 cells 24 h after treatment with scrambled or miRNA inhibitor. The cells were subsequently treated for another 24 h with control siRNAs or siRNAs specific to SHP2 and treated with hemin for 0, 48 or 72 h. (H) qPCR analysis of γ-globin mRNA in K562 cells, as described in (G). Error bars represent the standard deviation obtained from three independent experiments. (*) Significant changes of globin expression in the indicated group compared with the control (*P < 0.05). (I) K562 cells were hemin-treated for 48 h as in (G) and stained for CD71 and CD235a to determine the degree of erythroid differentiation. Summary of data obtained in FACS, showing the percentage of CD71+/CD235a+ population was shown in the right. Signals from western blots are normalized to GAPDH, and the values, expressed as fractions with respect to the control, are indicated below.

