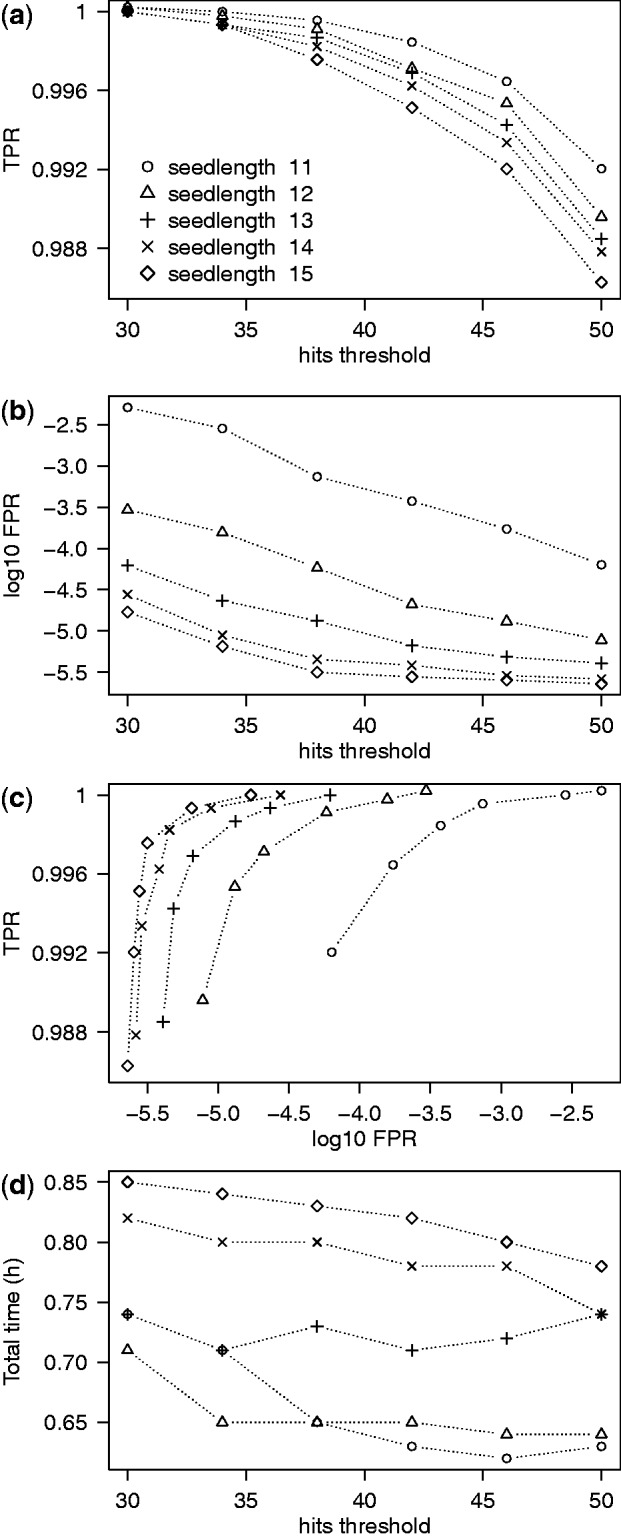
Figure 1.

Single-gene classification performance. (a) TPR of classification decreases with the hits parameter. (b) Proportion of reads that are actually off-target but pass through the classification procedure. As expected, this FPR decreases with s and H. (c) A ROC-style representation of the panels (a) and (b). To make the points distinguishable, the vertical scale only shows a small fraction of the full TPR range and the horizontal scale is logarithmic. The series of points in each seedlength group represent different hits thresholds. (d) Running time of classification and mapping. For reference, the running for the full alignment was 42 h.
