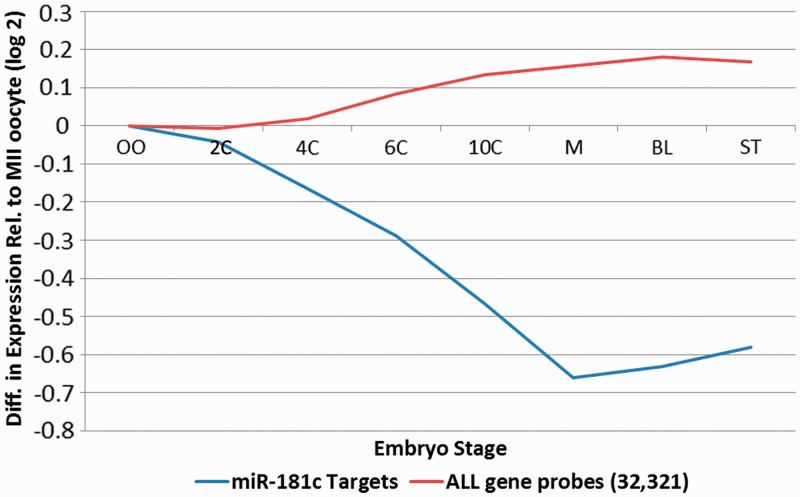
Figure 3.
Average level of miR-181C targets as a function of preimplantation embryonic development. The average level of 27 high-confidence predicted miR-181C targets through preimplantation embryonic development OO: Oocyte, M:Morula, BL:blastocyst, ST:Stem cell is shown in blue. This is compared to the relative level of non-targeted genes indicated in red.

