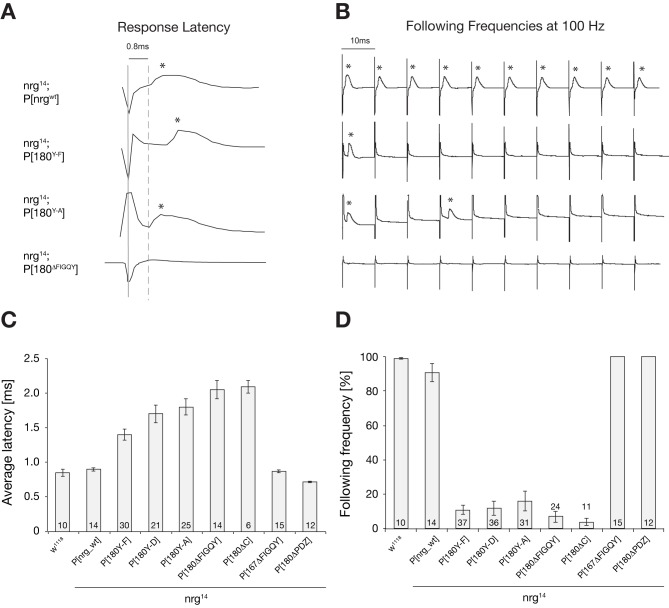
Figure 6. Electrophysiological phenotypes of nrg mutants in the giant fiber circuit.
(A and B) Sample traces of different nrg mutants. (A) TTM responses in nrg mutants (asterisks) upon GF stimulation in the brain (solid grey line). The average response latency in wild-type flies is 0.8 ms (dashed grey line). Sample traces of nrg14; P[nrgwt], nrg14; P[nrg180Y-F], nrg14; P[nrg180Y-A], and nrg14; P[nrg180ΔFIGQY] are shown. Mutations in the Nrg180-FIGQY motif led to a delay or absence of responses at the TTM. (B) As a measure for synaptic reliability, the ability to follow stimuli at 100 Hz was determined. In contrast to nrg14; P[nrgwt], the GF–TTM pathway in nrg14; P[nrg180Y-F], nrg14; P[nrg180Y-A], and nrg14; P[nrg180ΔFIGQY] mutants was not able to follow stimuli at 100 Hz upon GF stimulation in the brain; only rare responses were observed (asterisks). (C and D) Quantifications of electrophysiological phenotypes of nrg mutants. (C) Average latency of wild-type and nrg mutants. There was no significant difference (p = 0.681, Mann–Whitney Rank Sum Test) in the average response latency between control (w1118) and nrg14; P[nrgwt], nrg14; P[nrg167ΔFIGQY], or nrg14; P[nrg180ΔPDZ] flies. In contrast, the response latency was significantly increased in all nrg180 mutants with a mutated FIGQY motif (Mann–Whitney Rank sum test, p≤0.001). (D) Average following frequencies at 100 Hz in wild-type and nrg mutants. There was no significant difference (p = 0.841, Mann–Whitney Rank Sum Test) in the average of following frequencies at 100 Hz between control flies (w1118) and nrg 14; P[nrgwt], nrg 14; P[nrg167ΔFIGQY], and nrg 14; P[nrg180ΔFIGQY]. In contrast, following frequencies were significantly reduced in all nrg180 mutants with a missense mutation in or deletion of the FIGQY motif (Mann–Whitney Rank sum test, p≤0.001). Error bars represent SEM.

