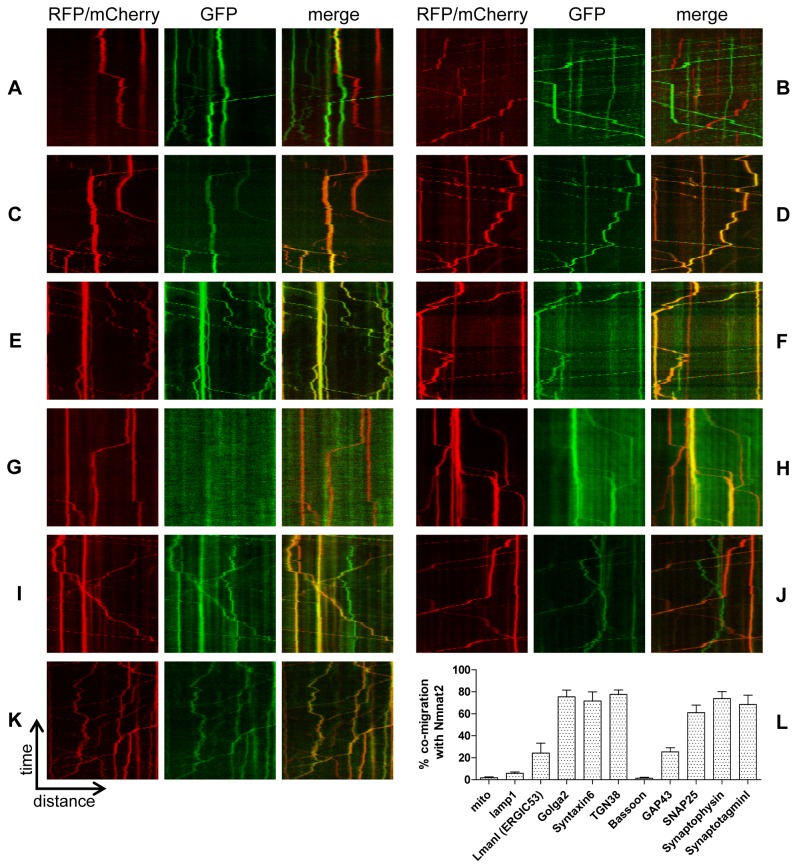
Figure 1. Nmnat2 co-migrates with markers for trans-Golgi and synaptic vesicles.
Co-migration was analysed using kymographs (time-distance graphs) obtained from live-cell imaging of neurites from primary culture SCG neurons. Representative kymographs from neurites co-labelled with Nmnat2-EGFP and (A) mito-tagRFP, (B) lamp1-RFP, or Nmnat2-mCherry and (C) LmanI-EGFP, (D) Golga2-EGFP, (E) Syntaxin6-EGFP, (F) TGN38-EGFP, (G) GFP-Bassoon, (H) GAP43-EGFP, (I) SNAP25b-EGFP, (J) Synaptophysin-EGFP, and (K) SynaptotagminI-EGFP. (L) Quantification of co-migration. The quantification shown for each construct represents the percentage of moving Nmnat2-labelled vesicles that were also labelled by the relevant marker. Error bars indicate SEM.

