
Figure 3. Hyperglycemia downregulates protein expression of STIM1 and SERCA3 in coronary ECs.
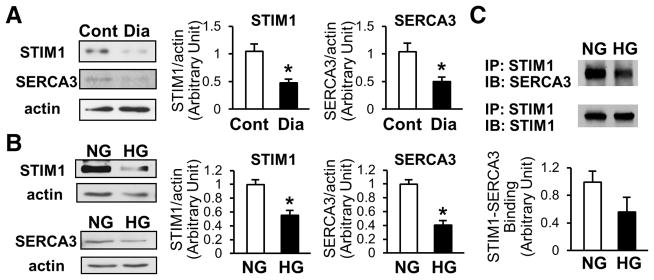
A, Freshly isolated coronary ECs from control mice (Cont, open bars) or diabetic mice (Dia, solid bars) were used to determine the protein concentration of STIM1 and SERCA3 by Western blot. Data are normalized by the signal of actin. STIM1; n=4 in each group, SERCA3; n=6 in each group. Data are mean±SEM. *P<0.05 versus Cont. B, Two days after the exposure of ECs to NG (open bars) or HG (solid bars), cells were lysed and protein concentration of STIM1 and SERCA3 was measured. STIM1, n=7 in each group; SERCA3, n=3 in each group. Data are mean±SEM. *P<0.05 versus NG. C, Immunoprecipitation (IP) of SERCA3 with STIM1. After NG or HG treatment, cells were lysed and IP was performed using anti-STIM1 N-terminus antibody. Immunoblotting (IB) was determined using anti-SERCA3 antibody. The same membrane was used for IB with anti-STIM1 C-terminus to normalize the data. For each group, n=3. Data are mean±SEM. *P<0.05 versus NG.