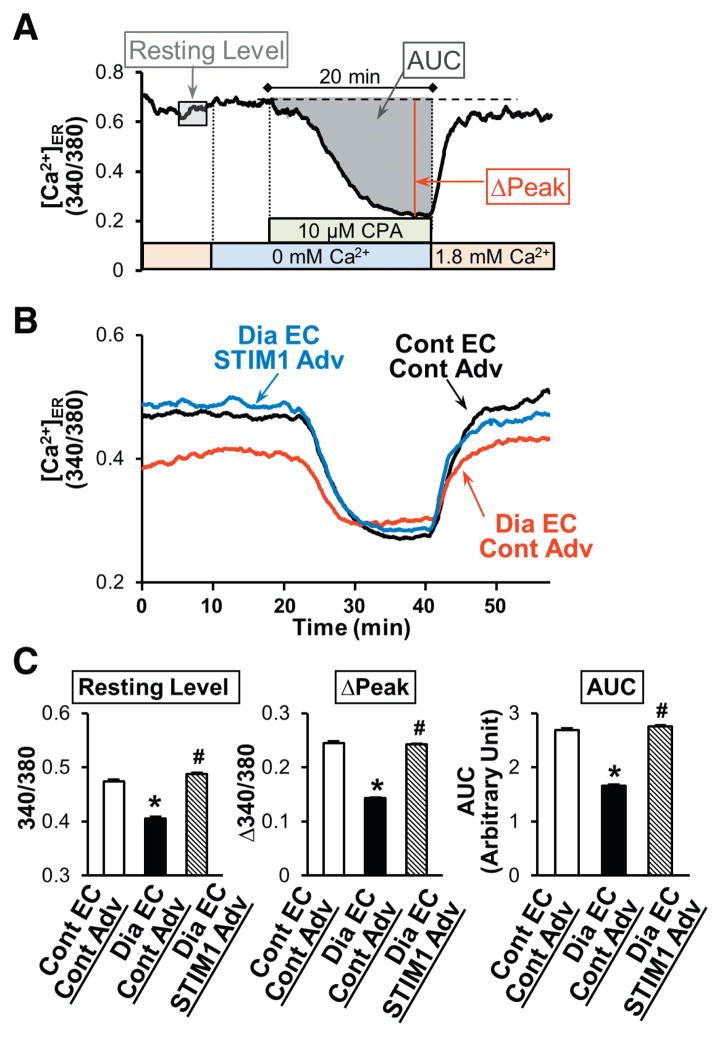
Figure 5. STIM1 overexpression increases the [Ca2+]ER in MCECs isolated from diabetic mice.
A, Typical record of the change in [Ca2+]ER in coronary ECs and the parameters used for the statistical analysis. B, Averaged record of the change in [Ca2+]ER in control MCECs infected with control-Adv (Cont EC–Cont Adv, black tracing), diabetic MCECs infected with control-Adv (Dia EC–Cont Adv, red tracing), and diabetic MCECs infected with STIM1 Adv (Dia EC–STIM1 Adv, blue tracing). C, Summarized data of resting level of [Ca2+]ER, ΔPeak, and the area under the curve (AUC; the change in [Ca2+]ER after CPA treatment). Cont EC–Cont Adv (open bars), n=25; Dia EC–Cont Adv (solid bars), n=21; and Dia EC–STIM1 Adv (hatched bars), n=30. Data are mean±SEM. *P<0.05 versus Cont EC–Cont Adv. #P<0.05 versus Dia EC–Cont Adv. ANOVA was performed to test the statistical difference between the groups.

