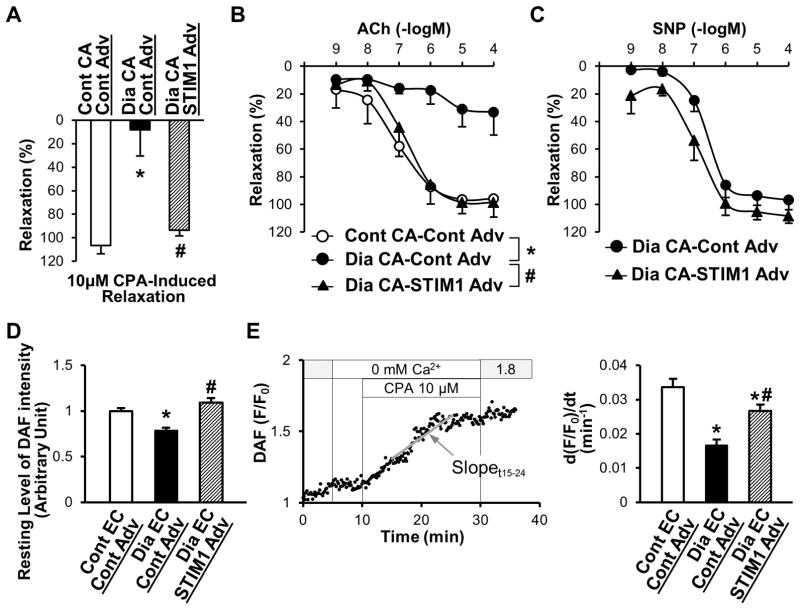
Figure 6. Overexpression of STIM1 restores CPA- and ACh-induced relaxation in diabetic CAs and increases nitric oxide (NO) production in diabetic MCECs.
A, After precontraction of the CAs, CPA-induced (10 μmol/L) vascular relaxation was observed. Relaxation was calculated versus the magnitude of the contraction induced by PGF2α and described as percentage. Control CAs infected with control Adv (Cont CA–Cont Adv, open bar), n=4; diabetic CAs infected with control Adv (Dia CA–Cont Adv, solid bar), n=5; diabetic CAs infected with STIM1 Adv (Dia CA–STIM1 Adv, hatched bar), n=3. Data are mean±SEM. *P<0.05 versus Cont CA– Cont Adv. #P<0.05 versus Dia CA–Cont Adv. B, Endothelium-dependent relaxation was determined by ACh-induced relaxation. After preconstruction of CAs, ACh was administrated with a dose-dependent manner. Cont CA–Cont Adv (open circles), n=4; Dia CA–Cont Adv (solid circles), n=5; Dia CA–STIM1 Adv (solid triangles), n=4. Data are mean±SEM. *P<0.05 versus Cont CA–Cont Adv. #P<0.05 versus Dia CA–Cont Adv. C, Endothelium-independent relaxation was determined by SNP-induced relaxation. After preconstruction of CAs, SNP was administrated with a dose-dependent manner. Dia CA–Cont Adv (solid circles), n=3; Dia CA–STIM1 Adv (solid triangles), n=3. Data are mean±SEM. D, Resting level of DAF intensity was obtained from the average intensity of first 2 to 4 minutes during Ca2+ PSS perfusion. Cont EC–Cont Adv (open bar), n=44; Dia EC–Cont Adv (solid bar), n=49; Dia EC–STIM1 Adv (hatched bar), n=44. Data are mean±SEM. *P<0.05 versus Cont EC–Cont Adv. #P<0.05 versus Dia EC–Cont Adv. E, NO production due to Ca2+ release/leakage from the ER during CPA treatment in coronary ECs. Left graph shows a typical record of DAF-FM intensity change indicated as F/F0. The slope between time 15 (t15) and time 24 (t24) (total 9 minutes) was calculated (gray line) and used as an indication of NO production in response to CPA [d(F/F0)/dt]. Right panel shows the summarized data of d(F/F0)/dt during CPA treatment (t15–t24). Cont EC–Cont Adv (open bar), n=44; Dia EC–Cont Adv (solid bar), n=49; Dia EC–STIM1 Adv (hatched bar), n=44. Data are mean±SEM. *P<0.05 versus Cont EC–Cont Adv. #P<0.05 versus Dia EC–Cont Adv. ANOVA was performed to test the statistical difference between the groups.

