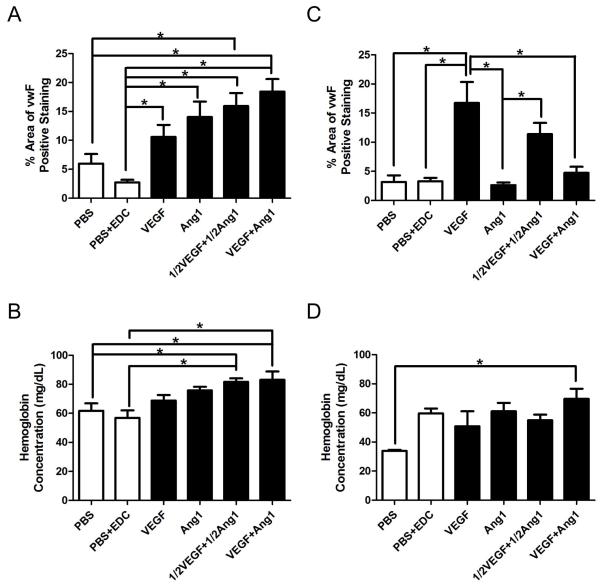
Figure 8. Image analysis and hemoglobin content analysis of chicken CAM assay.
(A) Percentage of area with positive Factor VIII (FVIII) staining for Fresh scaffolds. (B) Hemoglobin concentration within Fresh scaffolds. (C) Percentage of area with positive FVIII staining for Aged scaffolds. (D) Hemoglobin concentration within Aged scaffolds. * denotes statistically significant difference (P < 0.05; one-way ANOVA with post-hoc Tukey test). Figure reproduced from [14] with permission. Copyright Elsevier.

