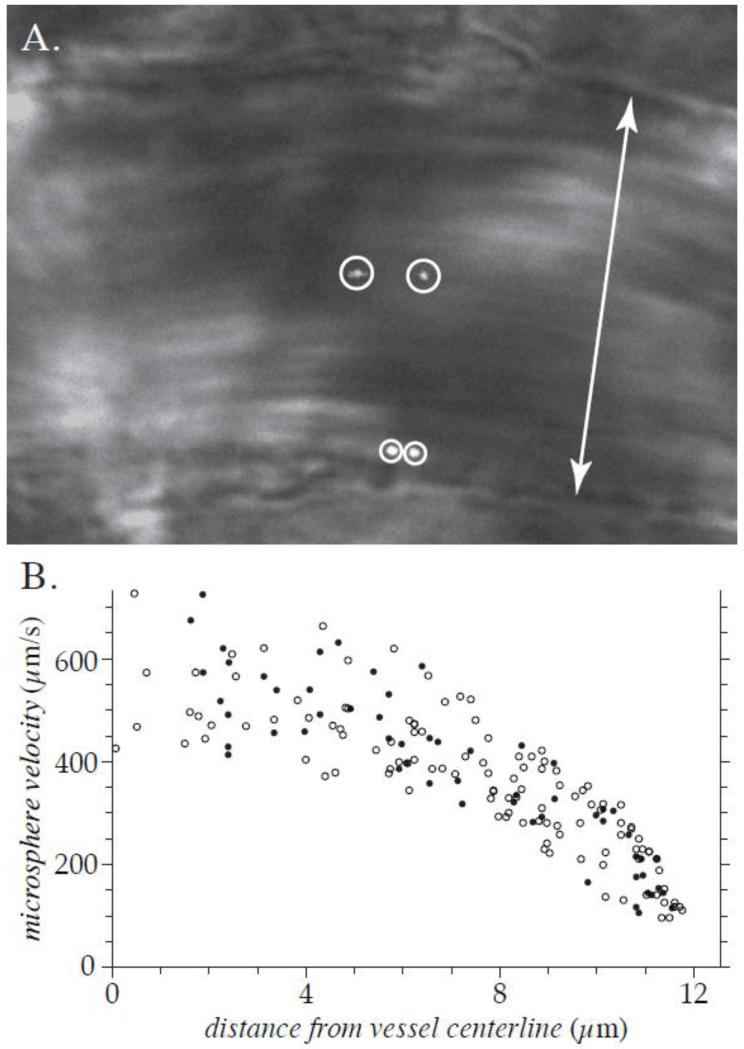
Figure 1. Typical image and data obtained in vivo.
These results are from a 25.1-μm-diameter venule in the cremaster muscle of an Sdc1−/− mouse, prior to hyaluronidase treatment. Shown in (A) is the brightfield image of the vessel, merged with the simultaneously acquired dual images of two fluorescent microspheres (encircled). The double arrow indicates the diameter of the venule. The full μ-PIV data set for this venule, folded onto one-half of the vessel cross-section, is shown in (B). The closed circles indicate data points measured from the vessel wall that is nearer to the top of the image in (A) and open circles indicate data points measured from the opposite wall. The velocity and radial location were measured for 172 microspheres in this venule. The monotonically filtered subset of this data is shown in Figure 2(A).

