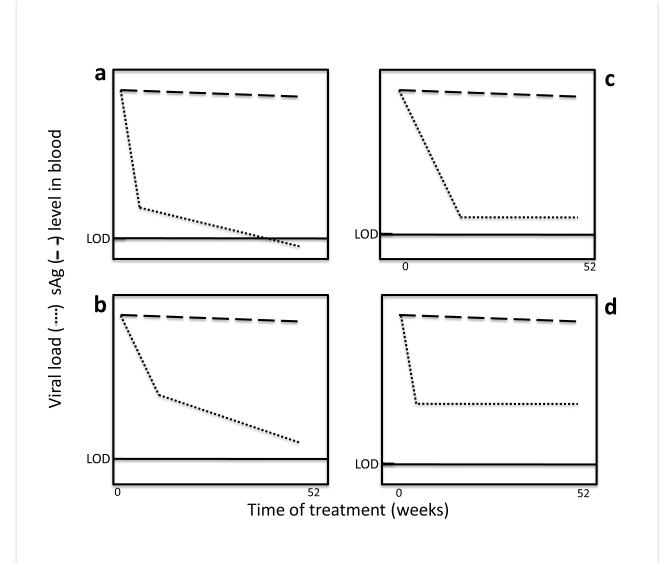
Figure 3. Hypothetical kinetics of HBV viremia and HBs antigenemia during DAA therapy.
The graphs indicate four different responses to treatment of chronic hepatitis B patients with the currently available DAAs (lamivudine, tenofovir or barraclude), as reflected in circulating levels of HBV viral DNA and HBsAg (Lok and McMahon 2009). The time of treatment 0 to 52 weeks. The values of viral load and HBsAg are relative and arbitrary, although the scale for viral load is in logs (usually covering at least 8 logs) and antigen levels as percentage of baseline (0-100%, or 2 logs). The solid bar stemming from the y axis (LOD) indicates the limit of detection of viral DNA, and shows that in many patients it stabilizes at or above the LOD.

