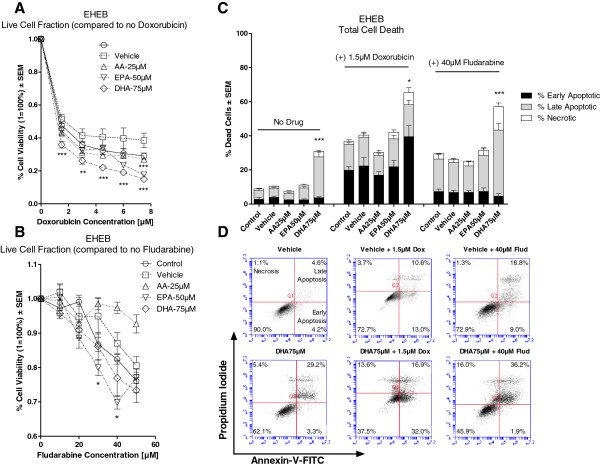
Figure 2.
In vitro sensitivity of EHEB following treatment with doxorubicin or fludarabine in the presence and absence vehicle, AA, EPA or DHA. Cell viability was determined by MTT assay. Percent (%) cell death was determined by Annexin-V/Propidium Iodide duel stain with flow cytometry. Figure 2A illustrates the % cell viability ± SEM of EHEB to doxorubicin (0–7.5 μM) in the presence or absence of vehicle, AA 25 μM, EPA 50 μM or DHA 75 μM. Cells pre-treated with either EPA or DHA had significantly greater decreases in cell viability as compared to vehicle when treatment with doxorubicin. Figure 2B illustrates the % cell viability ± SEM of EHEB to fludarabine (0-50 μM) in the presence or absence of vehicle, AA 25 μM, EPA 50 μM or DHA 75 μM. Pre-treatment of cells with EPA had significantly greater reductions in cell viability as compared to vehicle when treated with 30 μM and 40 μM fludarabine. Figure 2C illustrates the % dead cells ± SEM of EHEB following pre-treatment with vehicle, AA 25 μM, EPA 50μM or DHA 75 μM alone and following treatment with 1.5 μM doxorubicin or 40 μM fludarabine. Pre-treatment with DHA alone induced significantly greater cell death as compared to vehicle. Compared to vehicle, cells pre-treated with DHA had significantly higher cell death when treated with doxorubicin or fludarabine. Figure 2D provides 2D graphical representations of Annexin-V/PI Plots. ‘Early’ Apoptosis was defined as cells positive for Annexin-V-FITC only. ‘Late’ Apoptosis was defined as cells positive for Annexin-V-FITC and PI. ‘Necrotic’ was defined as cells positive for PI only. Statistical significance was determined by Multiple Comparison Test with Dunnet’s correction (Figure 2A and B) or Tukey’s correction (Figure 2C). α = 0.05, * <0.05, ** < 0.01, *** < 0.001.

