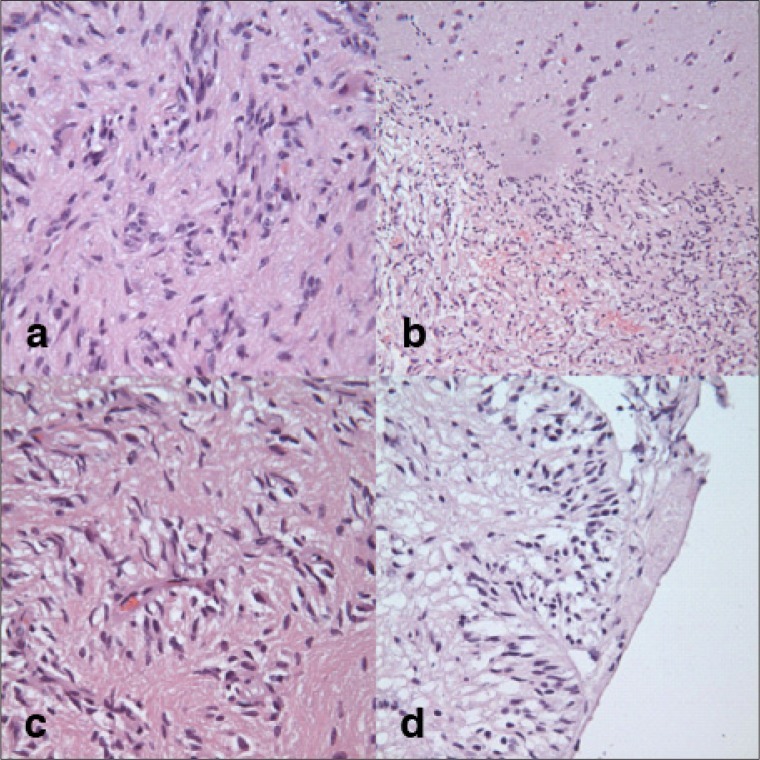
Figure 2.
Pathology evaluation of tumor.
a) Hematoxylin and eosin stain showing tumor cells; b) interface between the brain and the tumor; c) tumor cells that form pseudorosette type structures around the blood vessels; and d) tumor cells in subpial locations arranged in radial arrays perpendicular to the pial surface.

