
Fig. 2.
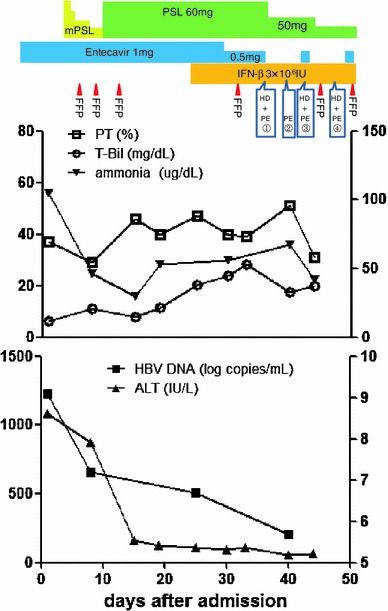
Clinical course of the present case. Upper panel shows the treatment course, and lower panel shows the course of the laboratory findings. Left longitudinal axis of the upper line graph shows PT (%) and T-Bil, and right axis shows ammonia. Left longitudinal axis of the lower line graph shows ALT, and right axis shows HBV DNA. mPSL methylprednisolone, PSL prednisolone, HD hemodialysis, PE plasma exchange, FFP fresh frozen plasma, T-Bil total bilirubin, ALT alanine aminotransferase, PT prothrombin time