
Figure 6.
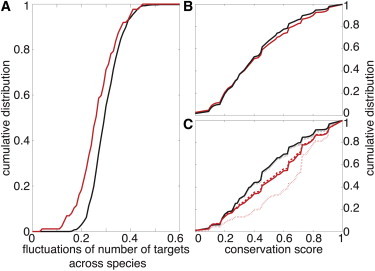
Conservation of microRNA targets across vertebrates. (A) Cumulative distributions for the relative fluctuations of the number of targets per microRNA across species for natural (red) and fake (black) microRNAs. Differences between the two distributions are significant (p-value < 10−4 for the Kolmogorov-Smirnov test). Number of targets is more conserved for natural microRNAs. (B) Cumulative distributions for the conservation scores of predicted targets of natural (red) and fake (black) microRNAs. Differences between the two distributions are small but significant (p-value < 10−10, Kolmogorov-Smirnov test). Proportion of conserved targets is slightly more important for natural microRNAs. (C) Cumulative distributions for the conservation scores of a subset of genes that are weak (red dashed line) or strong (red dotted line) targets of three natural microRNAs (miR-1, miR-124, and miR-181) in human (see Materials and Methods). (Red solid line) Distribution for the merged ensemble (weak and strong). (Black lines) Corresponding cumulative distributions for the same genes but when associated with fake microRNAs. Differences between natural and random microRNAs are always significant (p-values < 10−10, Kolmogorov-Smirnov test). Proportion of conserved targets is larger for strong targets of natural microRNAs, then for weak targets of natural microRNAs, then for targets of fake microRNAs.