
Figure 3.
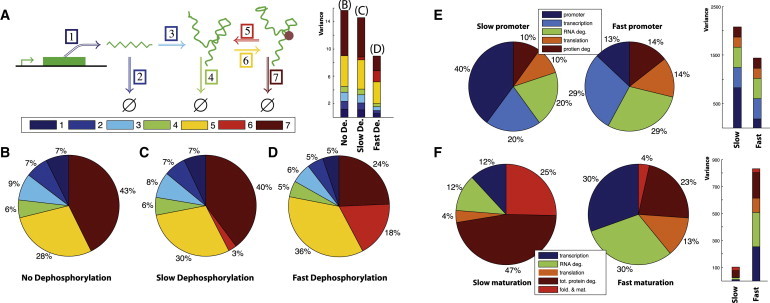
(A) Illustration of a protein expression and activation system with seven reactions; mRNA, protein, and activated protein are described in terms of their production, degradation, and potentially reversible (de-)activation through (de-)phosphorylation through kinases and phosphatases. (B) Variance decomposition of the noise in the output (active protein) when activation is not reversible. (C) Output variance decomposition for slow dephosphorylation. (D) Output variance for decomposition for fast dephosphorylation. For panels A–C, we use the following parameters: k+1 = 40, k−1 = 2, k+2 = 2, and k−2 = 1; for (A) kphos = 0.5 and kdephos = 0; for (B) kphos = 0.5 and kdephos = 0.1; for (C) kphos = 0.5 and kdephos = 1. (E) Contributions to the variance of the reactions involved in gene expression with fluctuating promoter states; here the transcription rate is modeled as , and y denotes the stationary solution of . The following parameters were used: V = 100, H = 50, k+2 = 2k−1 = 0.44, and k−2 = 0.55. For fast promoter fluctuations we used b = 50 and γ = 1, and for slow promoter fluctuations we used b = 0.5 and γ = 0.01. (F) Variance contributions of the reactions involved in fluorescent protein maturation model for slowly (left) and quickly (right) maturing proteins (slow and fast proteins). The following parameters were used: k+1 = 50, k−1 = 0.44, k+2 = 2, and k−2 = 0.55. For slow maturation (average maturation time ≈ 5 h) we assumed folding and maturation rates to be kf = 0.2 and km = 1.3, respectively. For fast maturation (average maturation time ≈ 0.5 h) we set kf = 2.48 and km = 13.6. All rates are per hour.