
Figure 2.
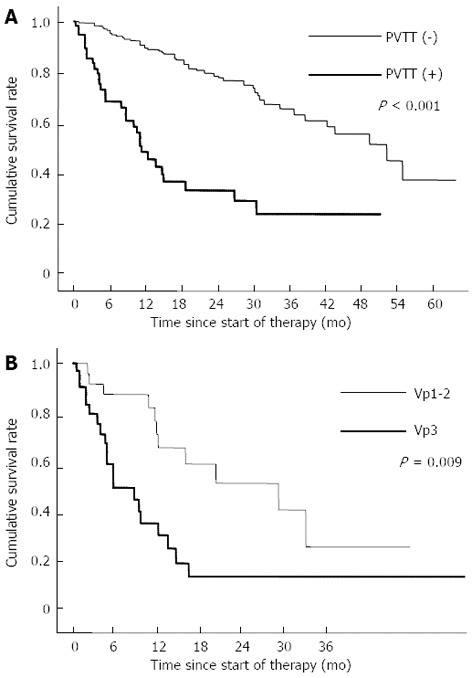
Cumulative survival rates. A: Comparison of cumulative survival rates between patients with no portal vein tumor thrombosis and those with portal vein tumor thrombosis; B: Comparison of the cumulative survival rates between patients with Vp1-2 and patients with Vp3. PVTT: Portal vein tumor thrombosis.