
Figure 2.
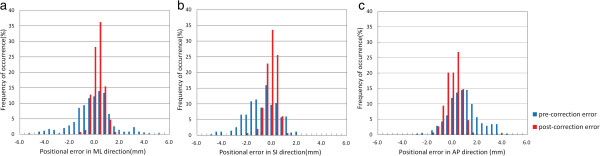
Distribution of differences between pre- or post-correction cone-beam computed tomography scans and planning CT scans. (a), (b) and (c) show the distribution of setup errors in the medial–lateral, superior–inferior and anterior–posterior directions, respectively.