
Figure 3.
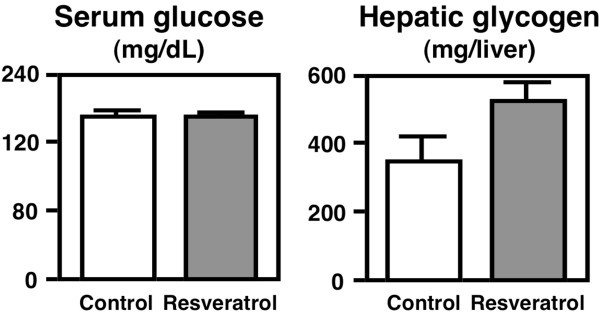
Serum glucose levels and liver glycogen contents in OLETF rats. The rats were fed a control diet or the resveratrol diet for 4 weeks. The values are expressed as the mean ± standard error for six mice. See Table 1 for the composition of the diets.