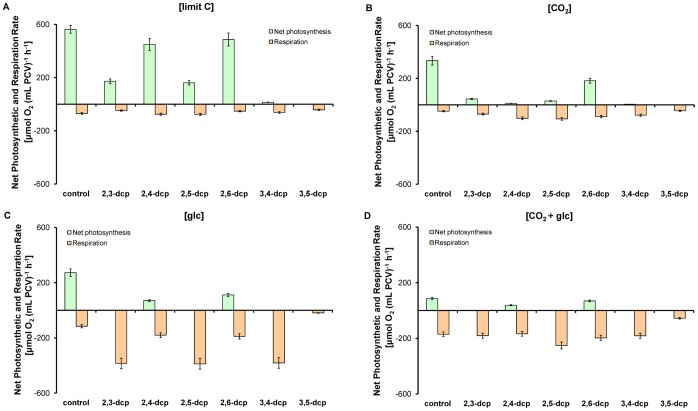
Figure 2. Polarographic determination of the maximal net photosynthetic and respiratory rates of Scenedesmus cultures treated with dcps.
(A) [limit C]-treatment, (B) [CO2]-treatment, (C) [glc]-treatment and (D) [CO2+glc]-treatment. The measurements were taken place the fifth incubation day. The values that are not presented in the diagrams are so low that are fitted in with the x-axes.

