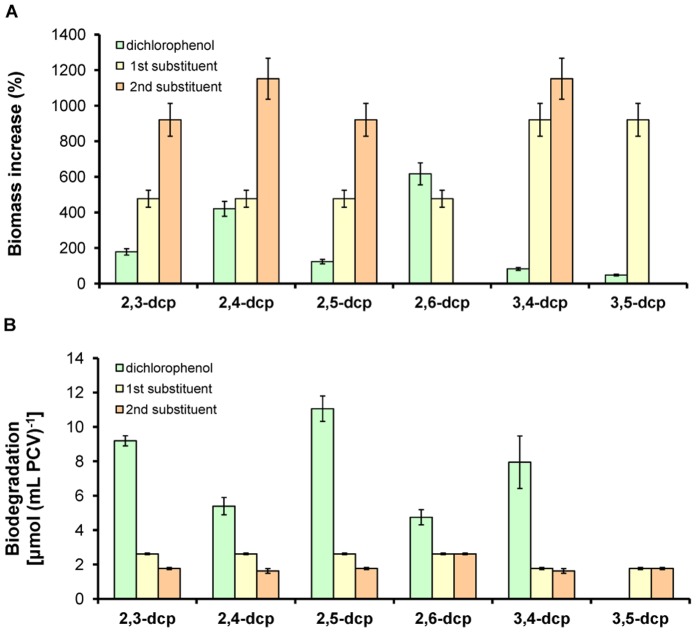
Figure 5. Comparative biodegradation strategy between cps and dcps in [glc]-treatment.
(A) Biomass increase (change of the biomass in percentage between the fifth experimental day and the start of the experiment) of dcps versus the corresponding cps (those that a dcp could be divided into) at the same experimental conditions. [2,3-dcp was compared with 2-cp and 3-cp, 2,4-dcp with 2-cp and 4-cp, 2,5-dcp with 2-cp and 3-cp (5-cp is the structure of 3-cp), 2,6-dcp with 2-cp (6-cp is the structure of 2-cp), 3,4-dcp with 3-cp and 4-cp, while 3,5-dcp with 3-cp (5-cp is the structure of 3-cp)]. (B) Biodegradation per packed cell volume of dcps versus the corresponding cps (as explained above) at the same experimental conditions. The values that are not presented in the diagrams are so low that are fitted in with the x-axes.

