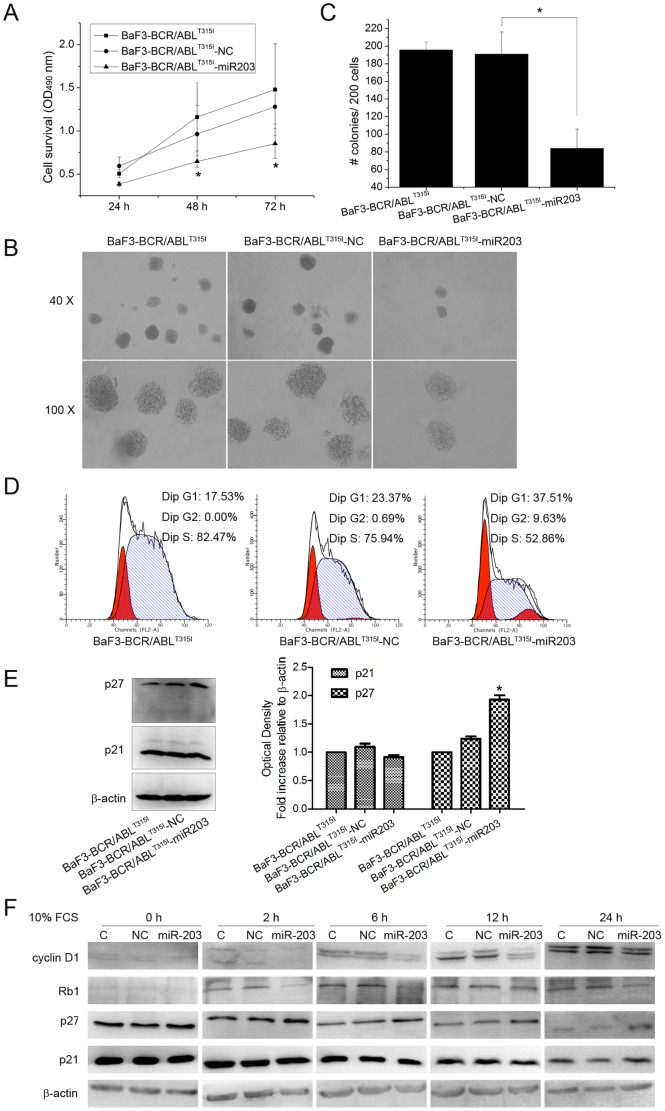
Figure 3. Overexpression of miR-203 inhibits the growth of BaF3-BCR/ABLT315I cells.
(A) Growth of BaF3-BCR/ABLT315I, BaF3-BCR/ABLT315I -NC and BaF3-BCR/ABLT315I-miR203 cells was compared using MTT assay. (B) Cells were cultured in methylcellulose for 8 days and colonies containing ≥50 cells in each well were counted. (C) Histogram and statistics showing the number of colonies per 200 plated cells. (D) Cells without synchronized were collected for cell cycle analysis. The percentages of cells in the G1, G2, and S phases were evaluated by flow cytometry and BaF3-BCR/ABLT315I-miR203 cells were arrested in the G1 phase. (E) The protein levels of G1 cell cycle regulatory proteins p21 and p27 were evaluated using Western blot with lysates from cells without synchronized. β-actin was used as internal control. Densiometric analysis of p21 and p27 correlated to β-actin level is presented as fold increase compared with untreated BaF3-BCR/ABLT315I cells. * P<0.05 versus control groups. (F) Cells were left hungry for 48 h without serum (0 h). After serum starvation, the synchronized cells were incubated with 10% FCS for 2 h, 6 h, 12 h, and 24 h. Then, these cells were harvested for Western blot to determine the level of p21, p27, cyclin D1 and Rb1. β-actin was used as internal control. C, NC and miR-203 indicate lysates from control cell line BaF3-BCR/ABLT315I, BaF3-BCR/ABLT315I -NC and BaF3-BCR/ABLT315I-miR203, respectively.

