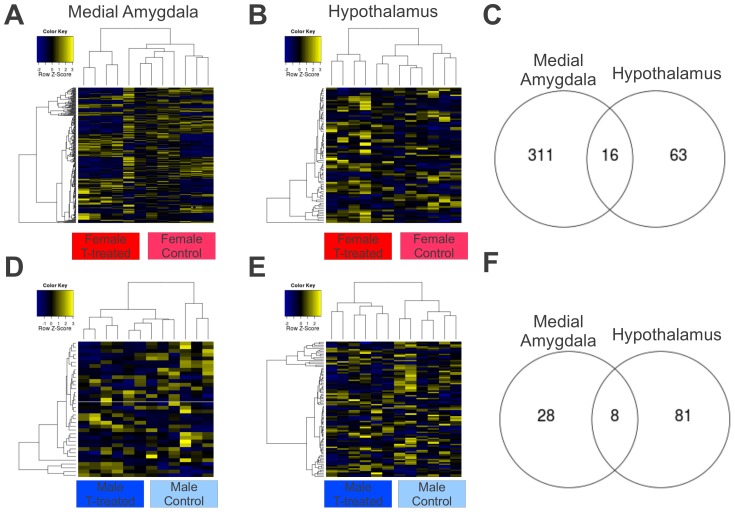
Figure 2. Gene expression in response to T-treatment in each sex.
Differences in gene expression between T-treated and control individuals in both the medial amygdala (left column) and the hypothalamus (middle column) for response to females (a–c) and in males (d–fh). Heat maps show scaled individual expression scores for just the genes that were significantly differentially expressed between T-treated and control individuals in each sex (a,b,d,e). Venn diagram shows the overlap of significant within each contrast between the tissues. See text and supplementary tables for more information.

