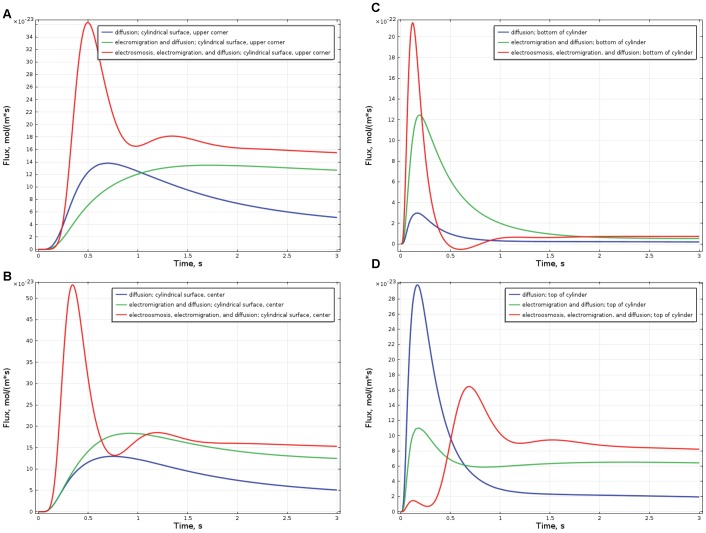
Figure 4. Time dependence of the flux of the messenger proteins onto the nucleus.
The flux of the messenger proteins normal to the surface of the nucleus is integrated over this surface. Red curves present the total flux due to electroosmosis, electromigration, and diffusion. For comparison, blue curves present the flux due to pure diffusion, and green curves present the flux due to diffusion and electromigration. In Figure 4A messengers are initially located near the upper corner of the cell (as in Fig. 2), in Figure 4B near the center of the cylindrical surface, in Figure 4C at the bottom of the cylinder (as in Fig. 3), and in Figure 4D at the top of the cylinder. Note that everywhere, except Fig. 4D, electroosmosis facilitates faster and more intense transport of messengers onto the surface of the nucleus. See text for more detailed discussion.

