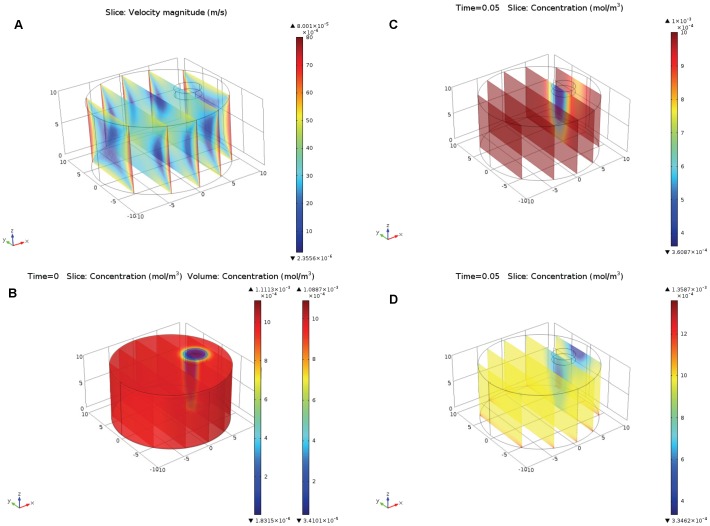
Figure 5. The 3D model of the fluorescence recovery after photobleaching in the polarized cell.
Mathematical model described by eqs. (7–8) with initial condition (13), representing photobleaching by laser beam. Small cylinder near the top of the cell represents the area across which the recovery of photobleaching is observed (averaged). Figure 5A represents the magnitude of electroosmotic flow velocity (similar to Fig. 1C, but in 3D). Figure 5B presents the concentration of the fluorescently labeled protein after photobleaching, t = 0. Figure 5C–recovery of the fluorescence (concentration of the fluorescent protein) due to pure diffusion, t = 0.05. Figure 5D–recovery of the fluorescence due to electroosmosis and diffusion.

